GLOBE Surface Temperature
Naperville Community Unit School District 203
December 20, 2007
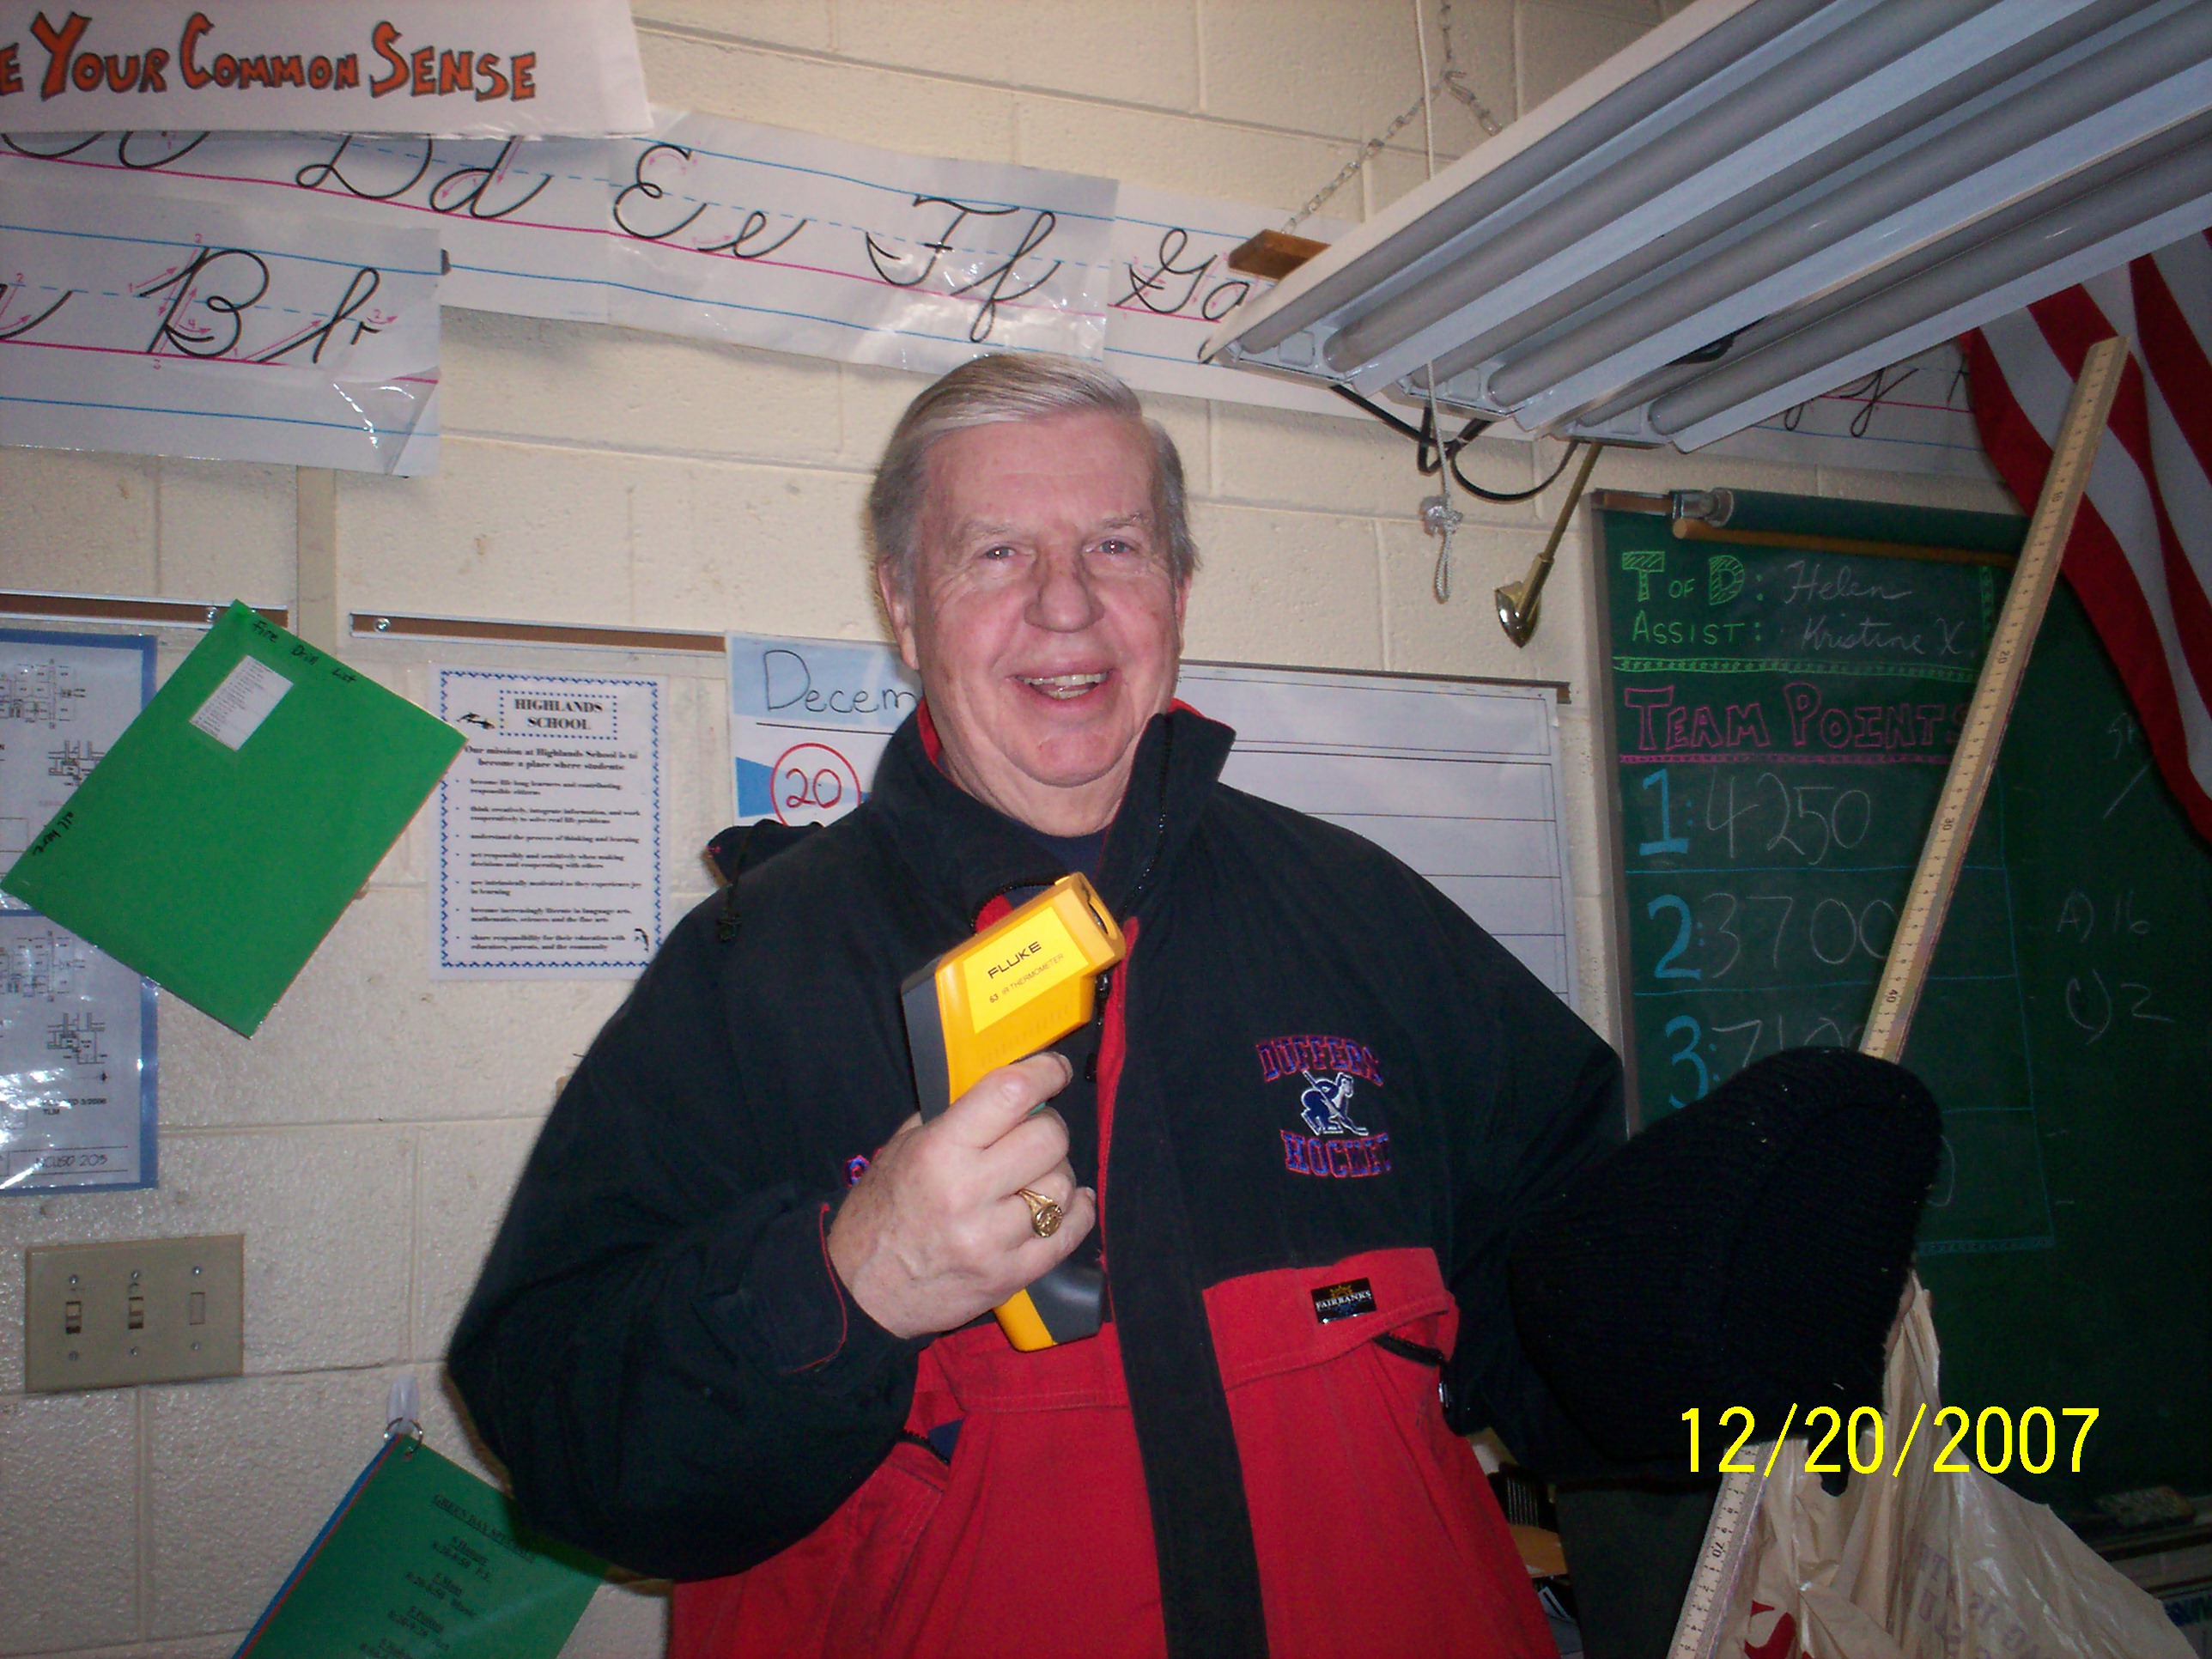
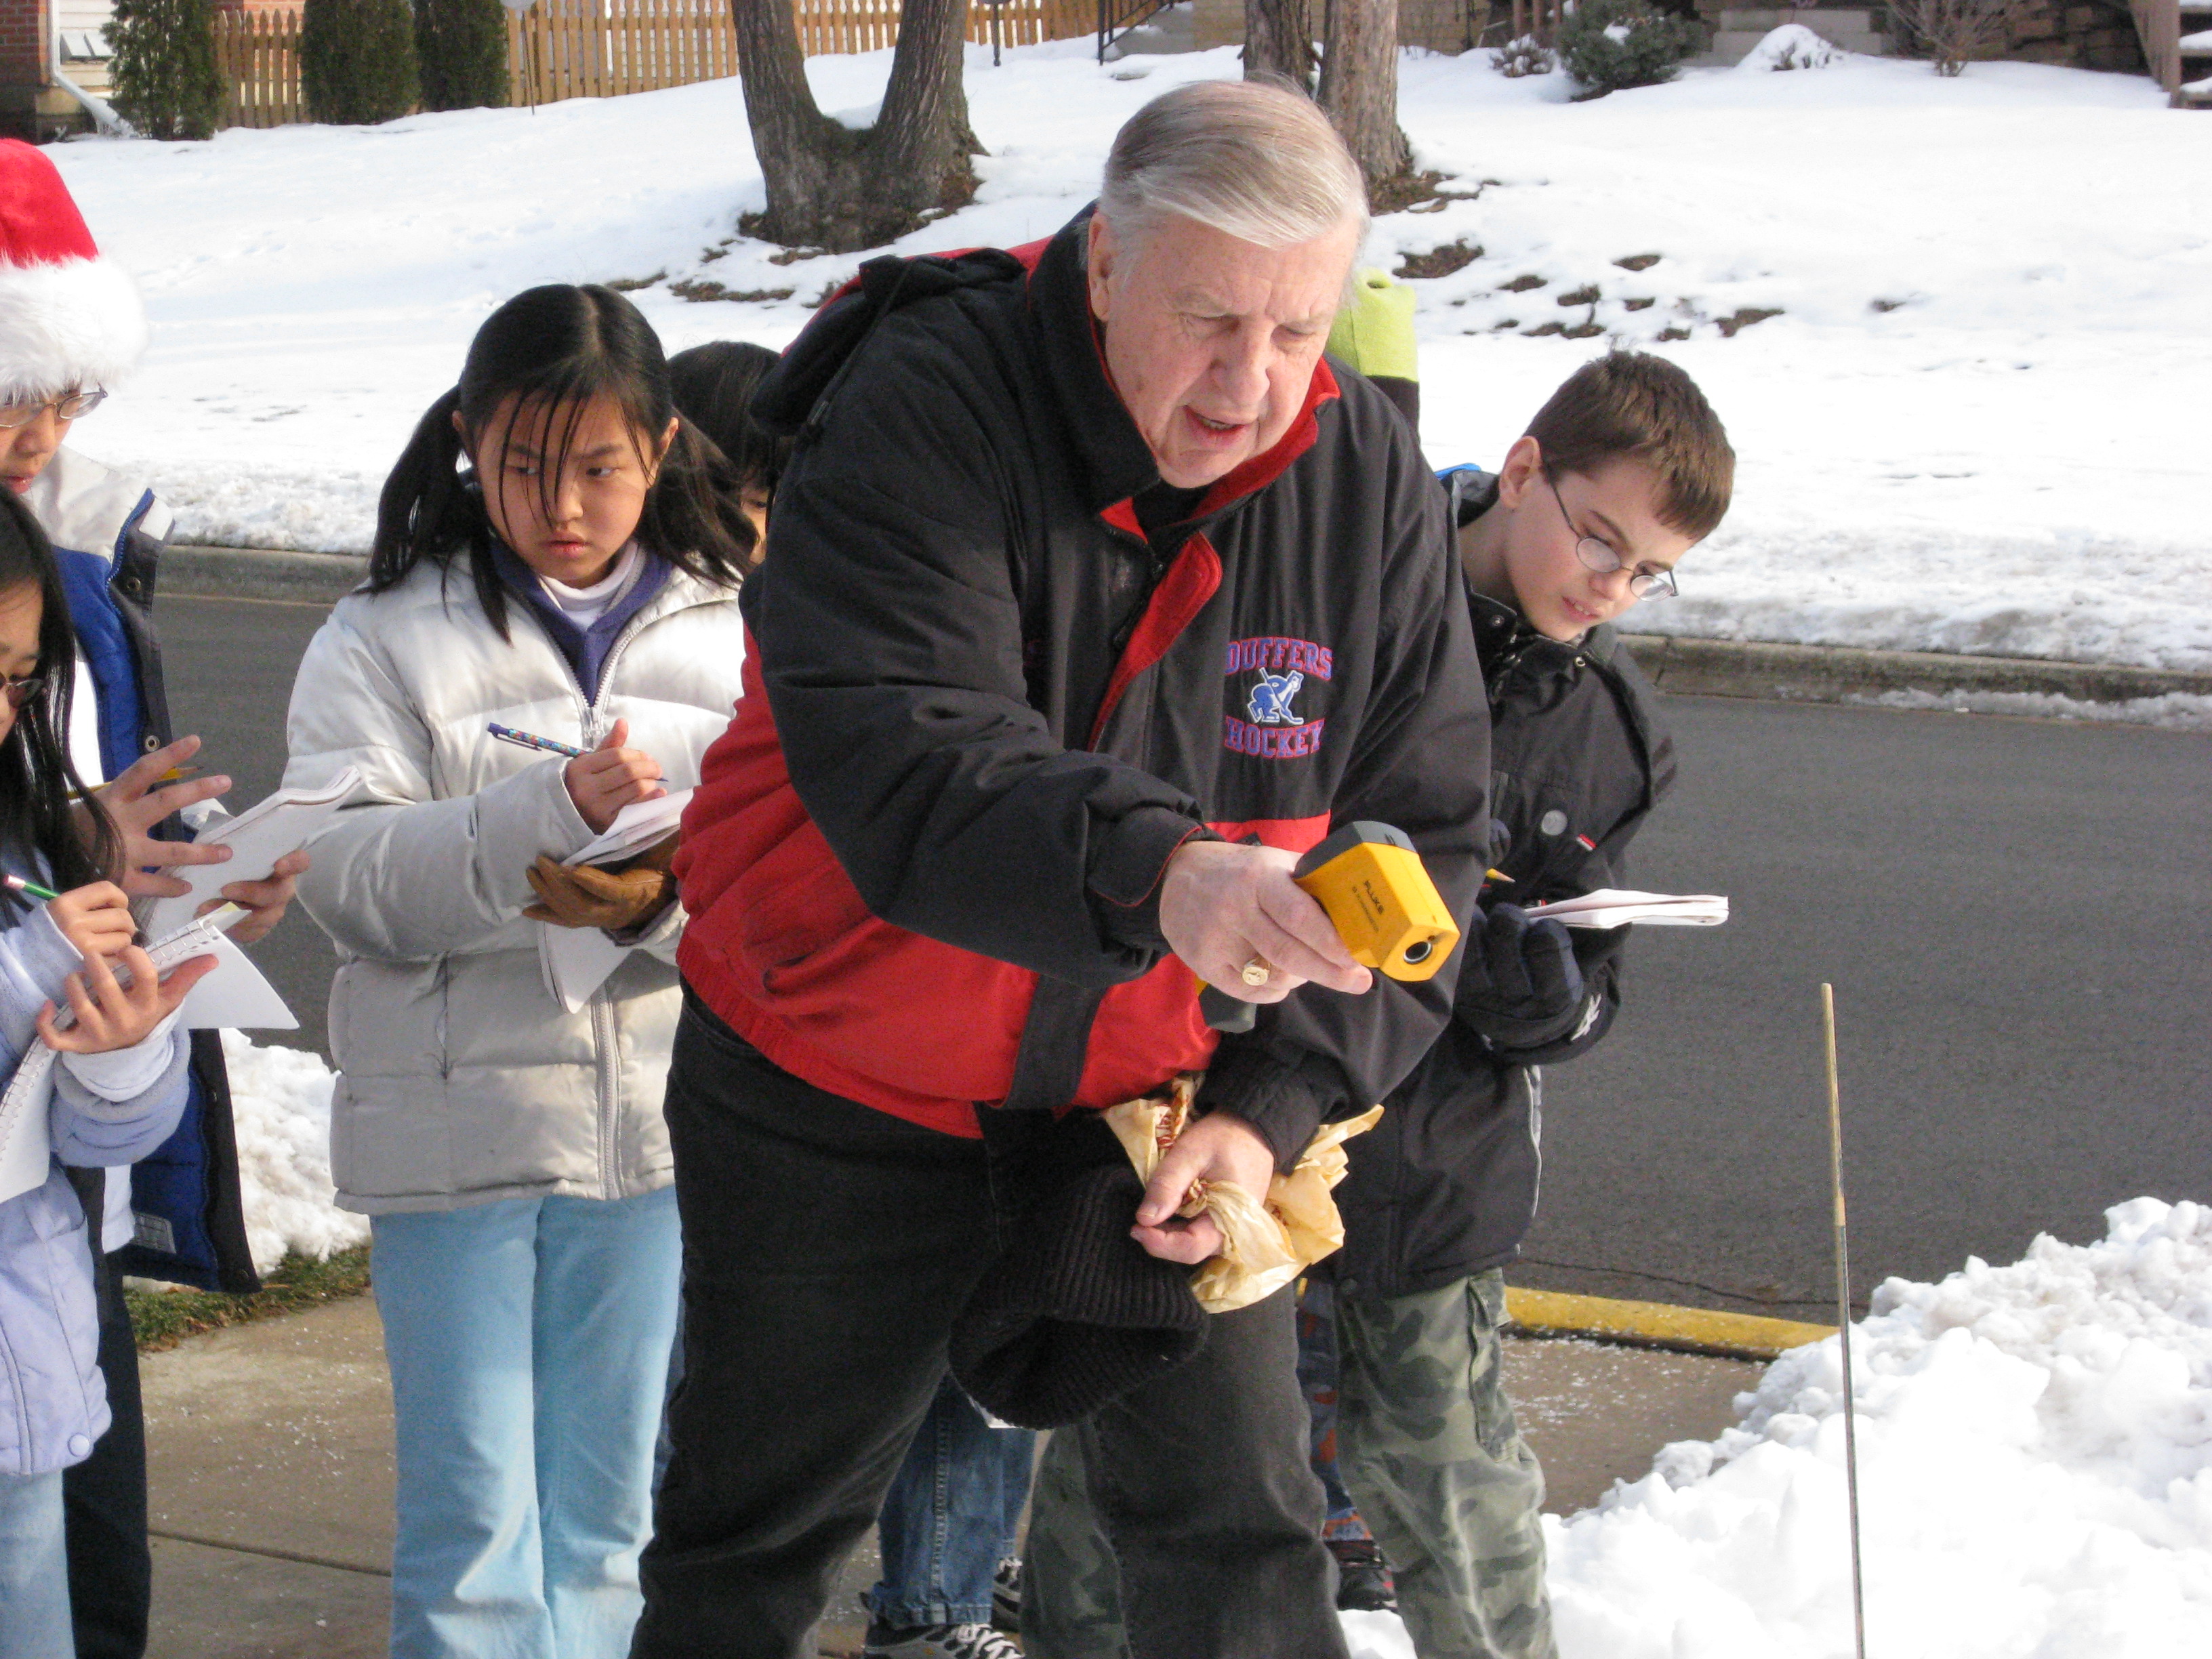
Mr. Lopatka used a Fluke 63 Surface Thermometer that was chilled to the outside temperature. (That Prevents shock when a warm thermometer goes out into the cold) |
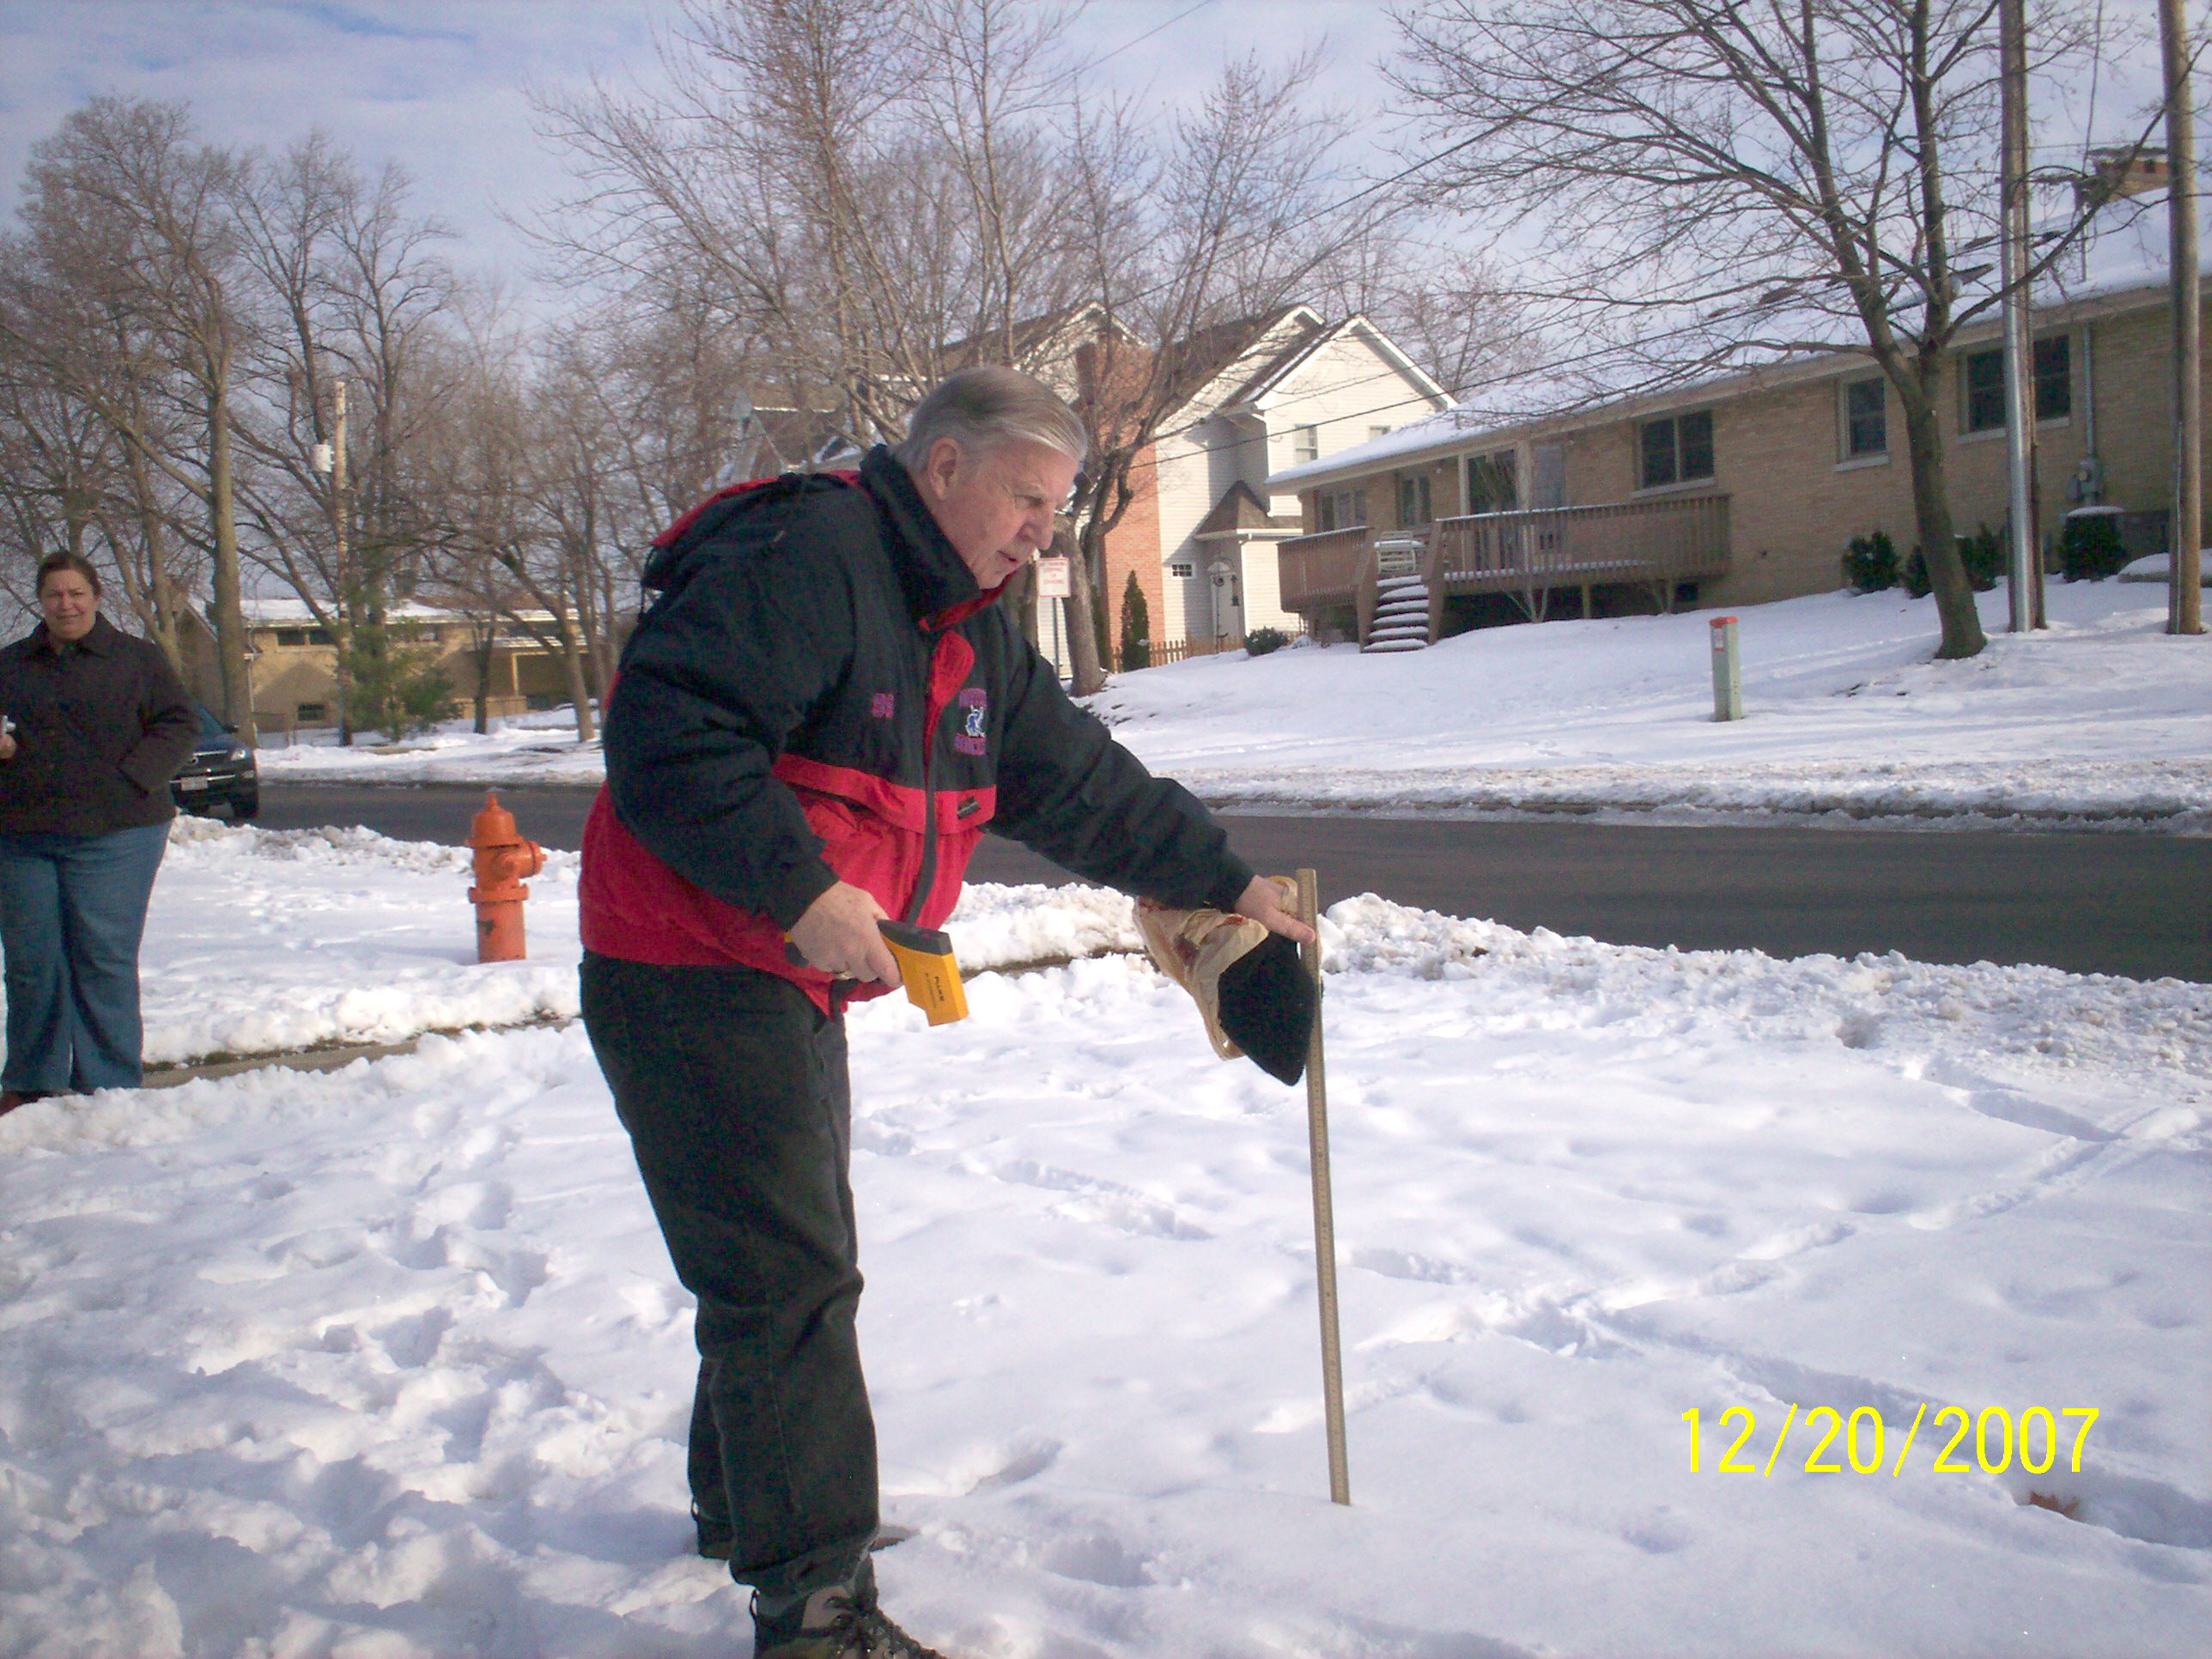
We measured the dept of the snow in millimeters, then we took the Celsius temperature of the snow at that point. (Our snow dept measured between 90 and 108 Millimeters.) |
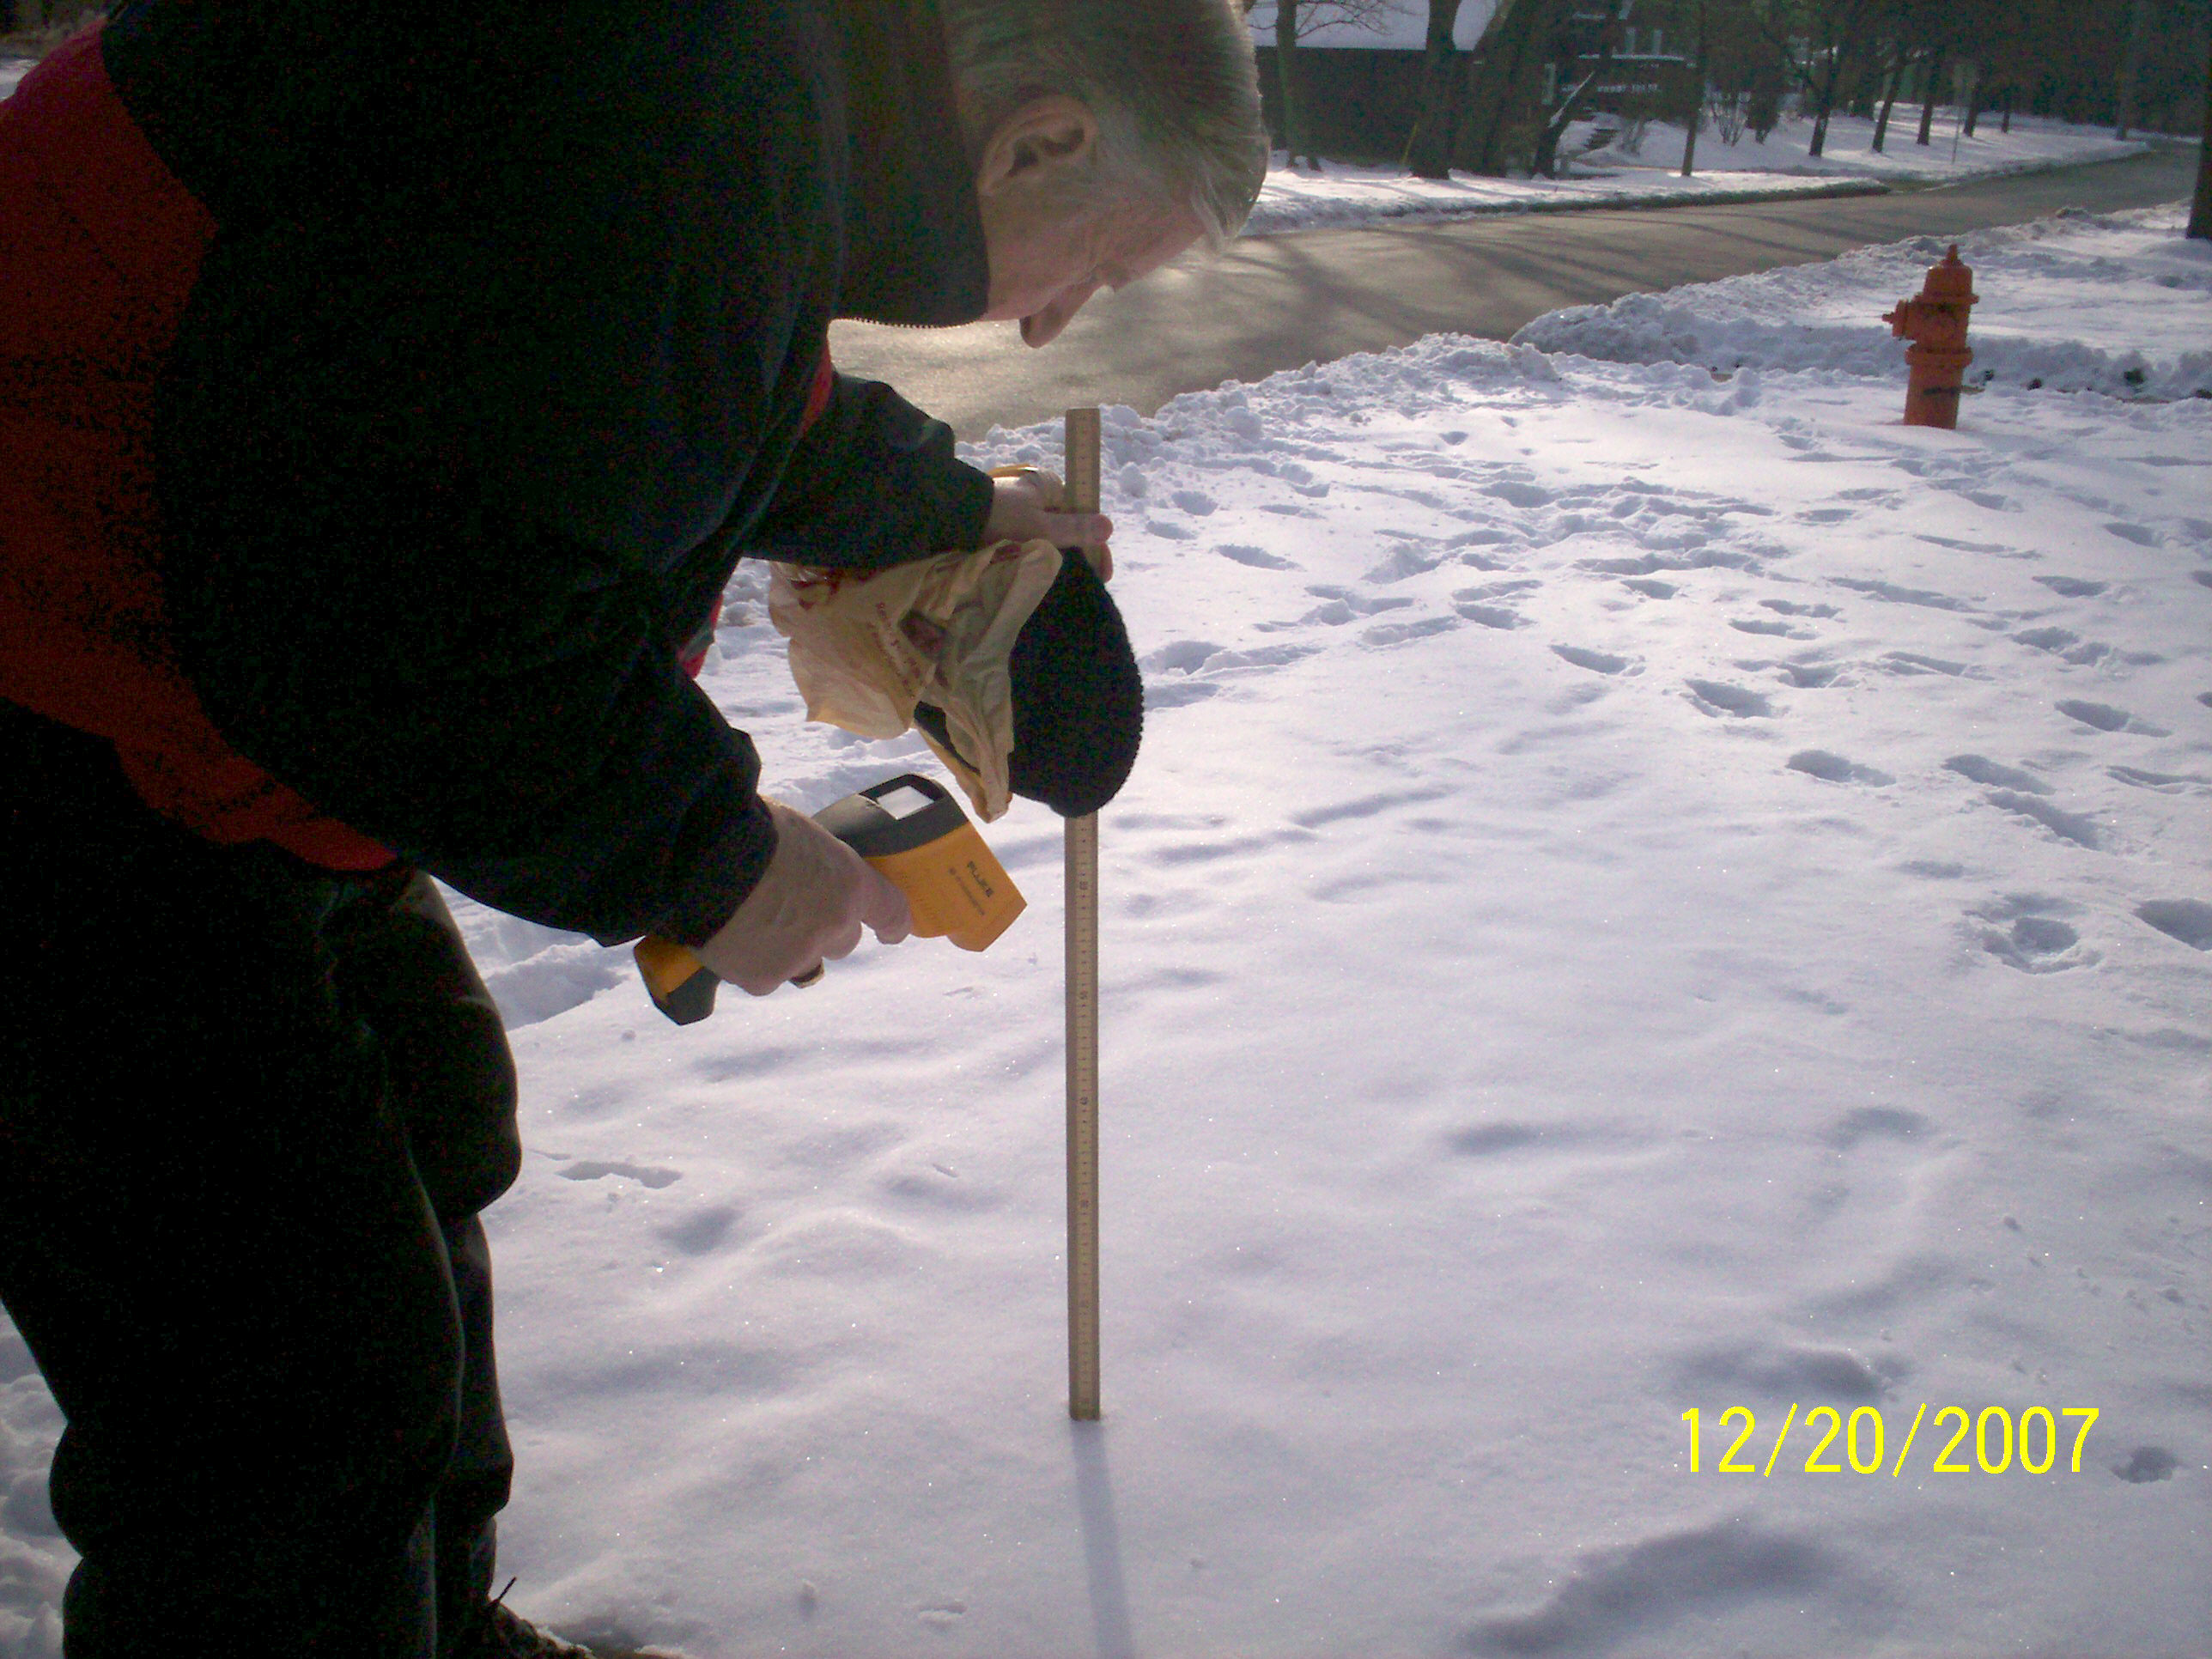
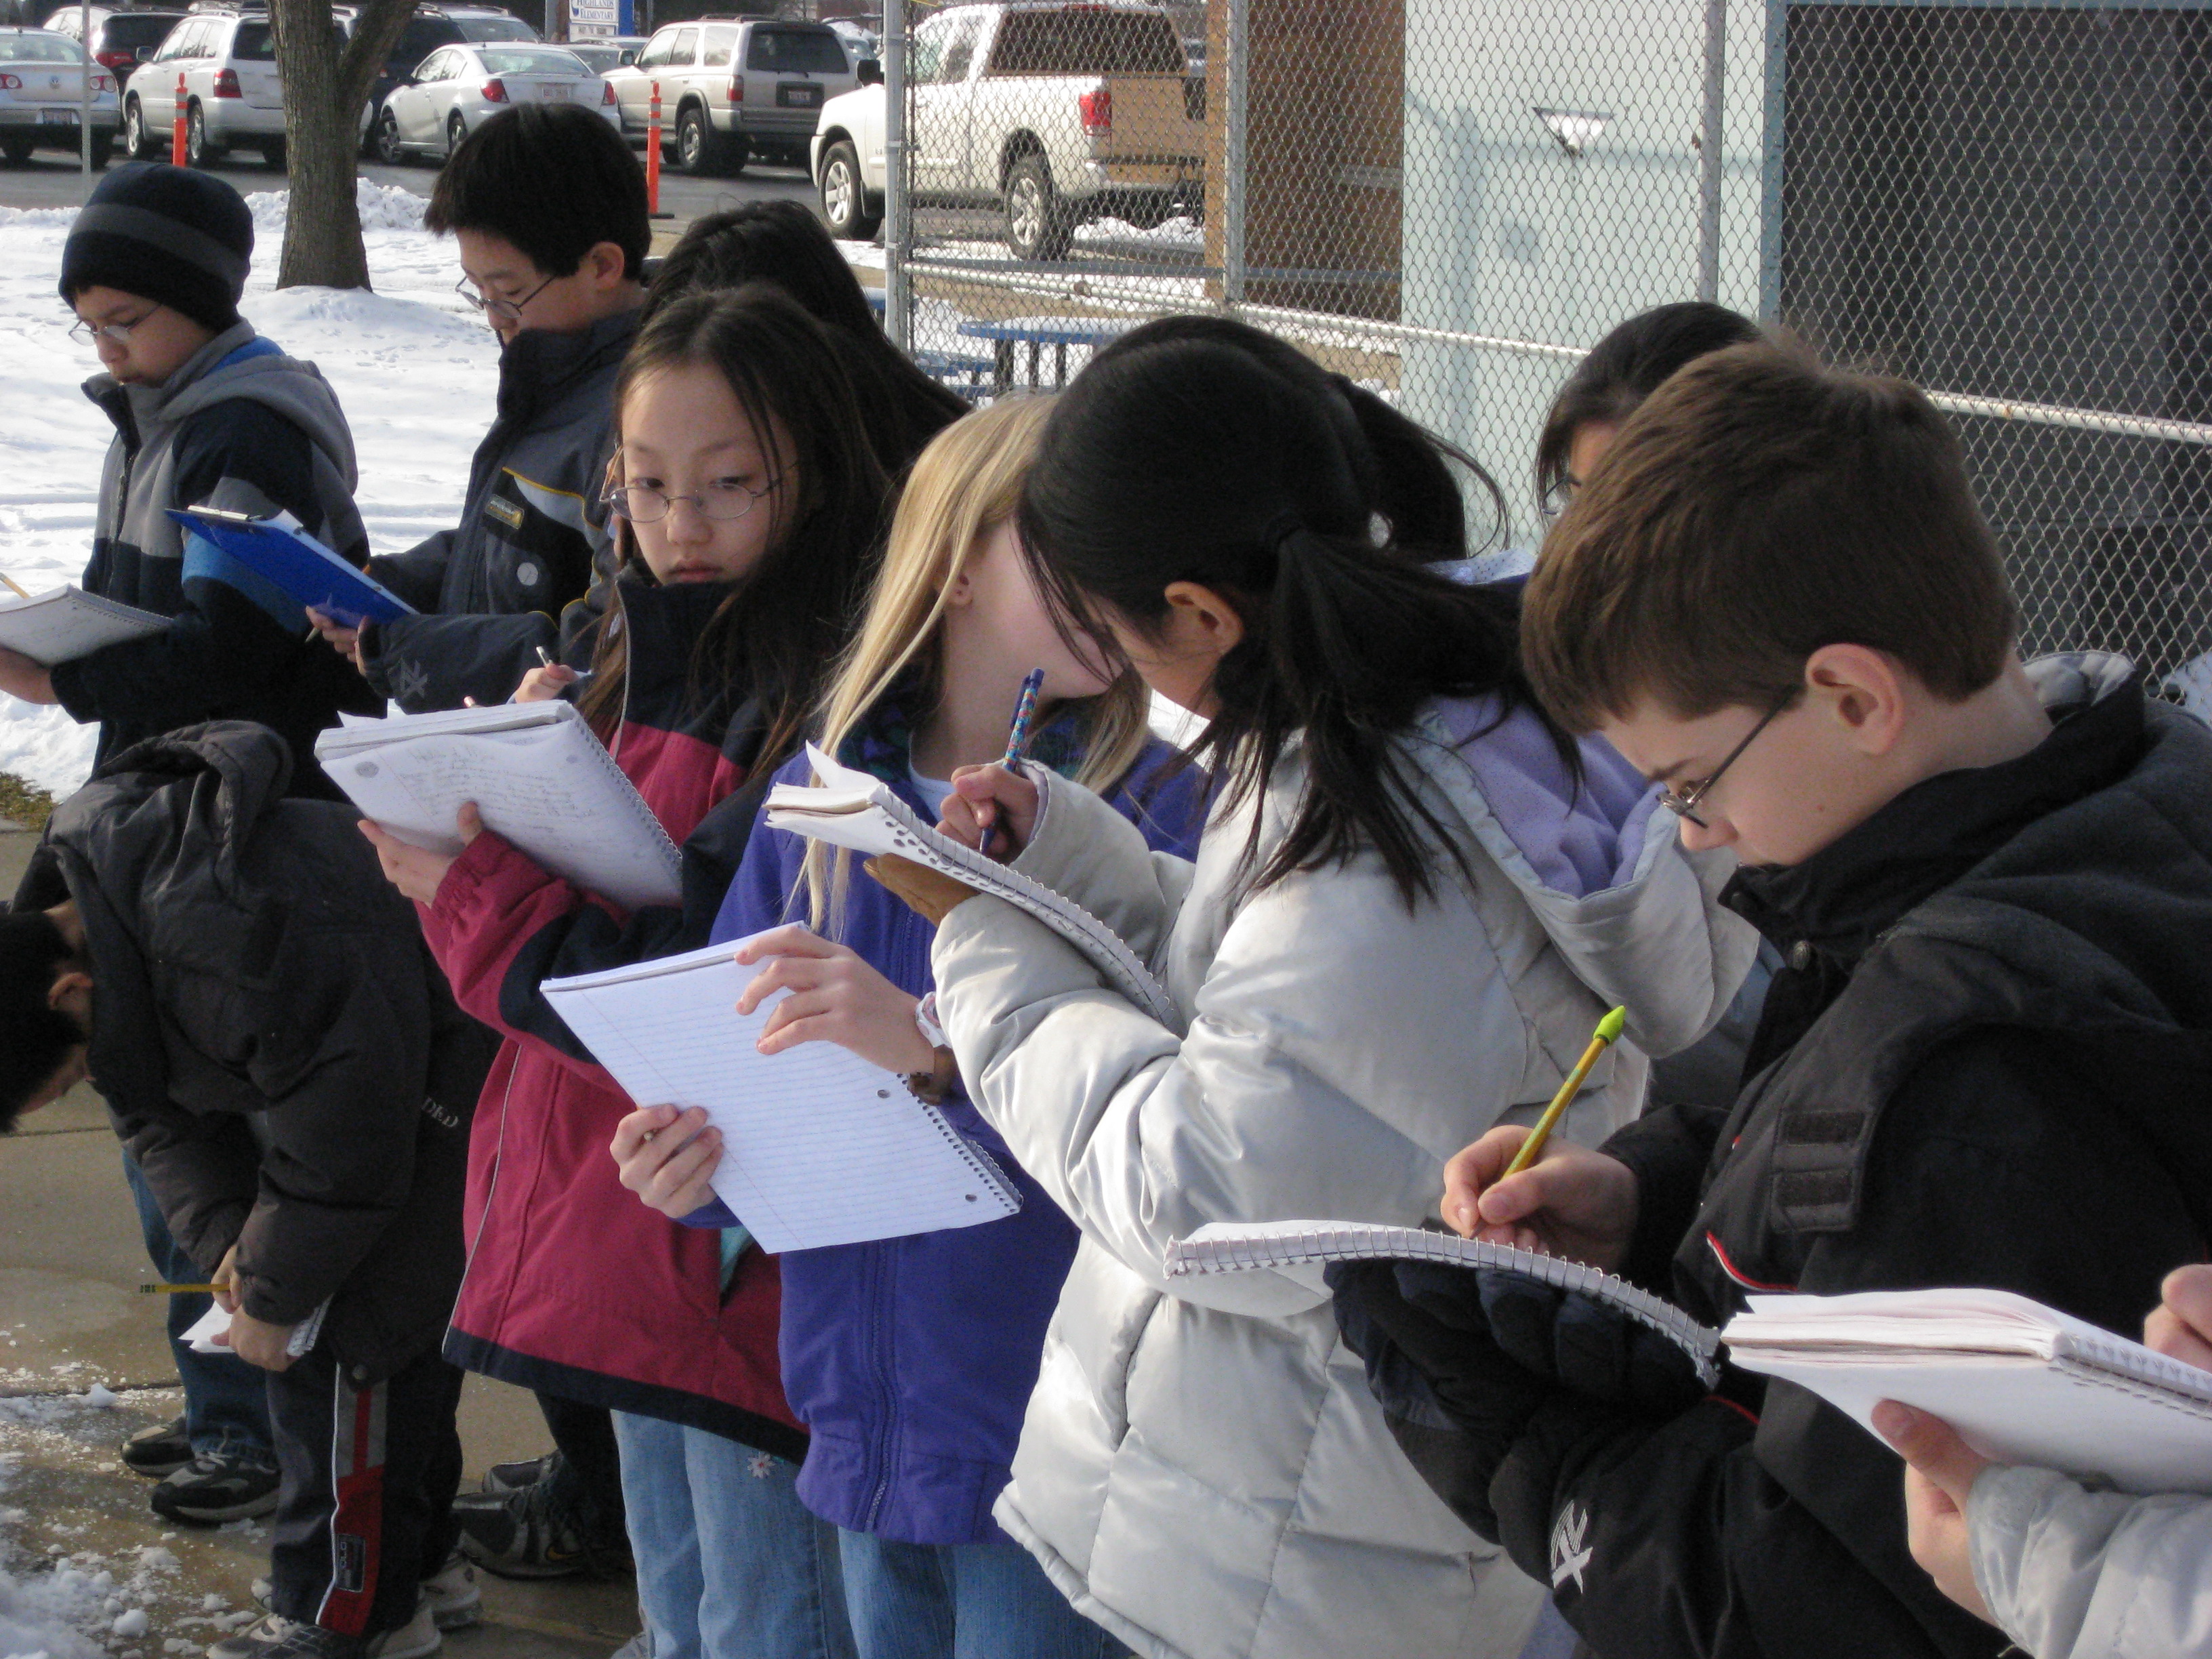
We took surface temperature readings at 9 different spots. |
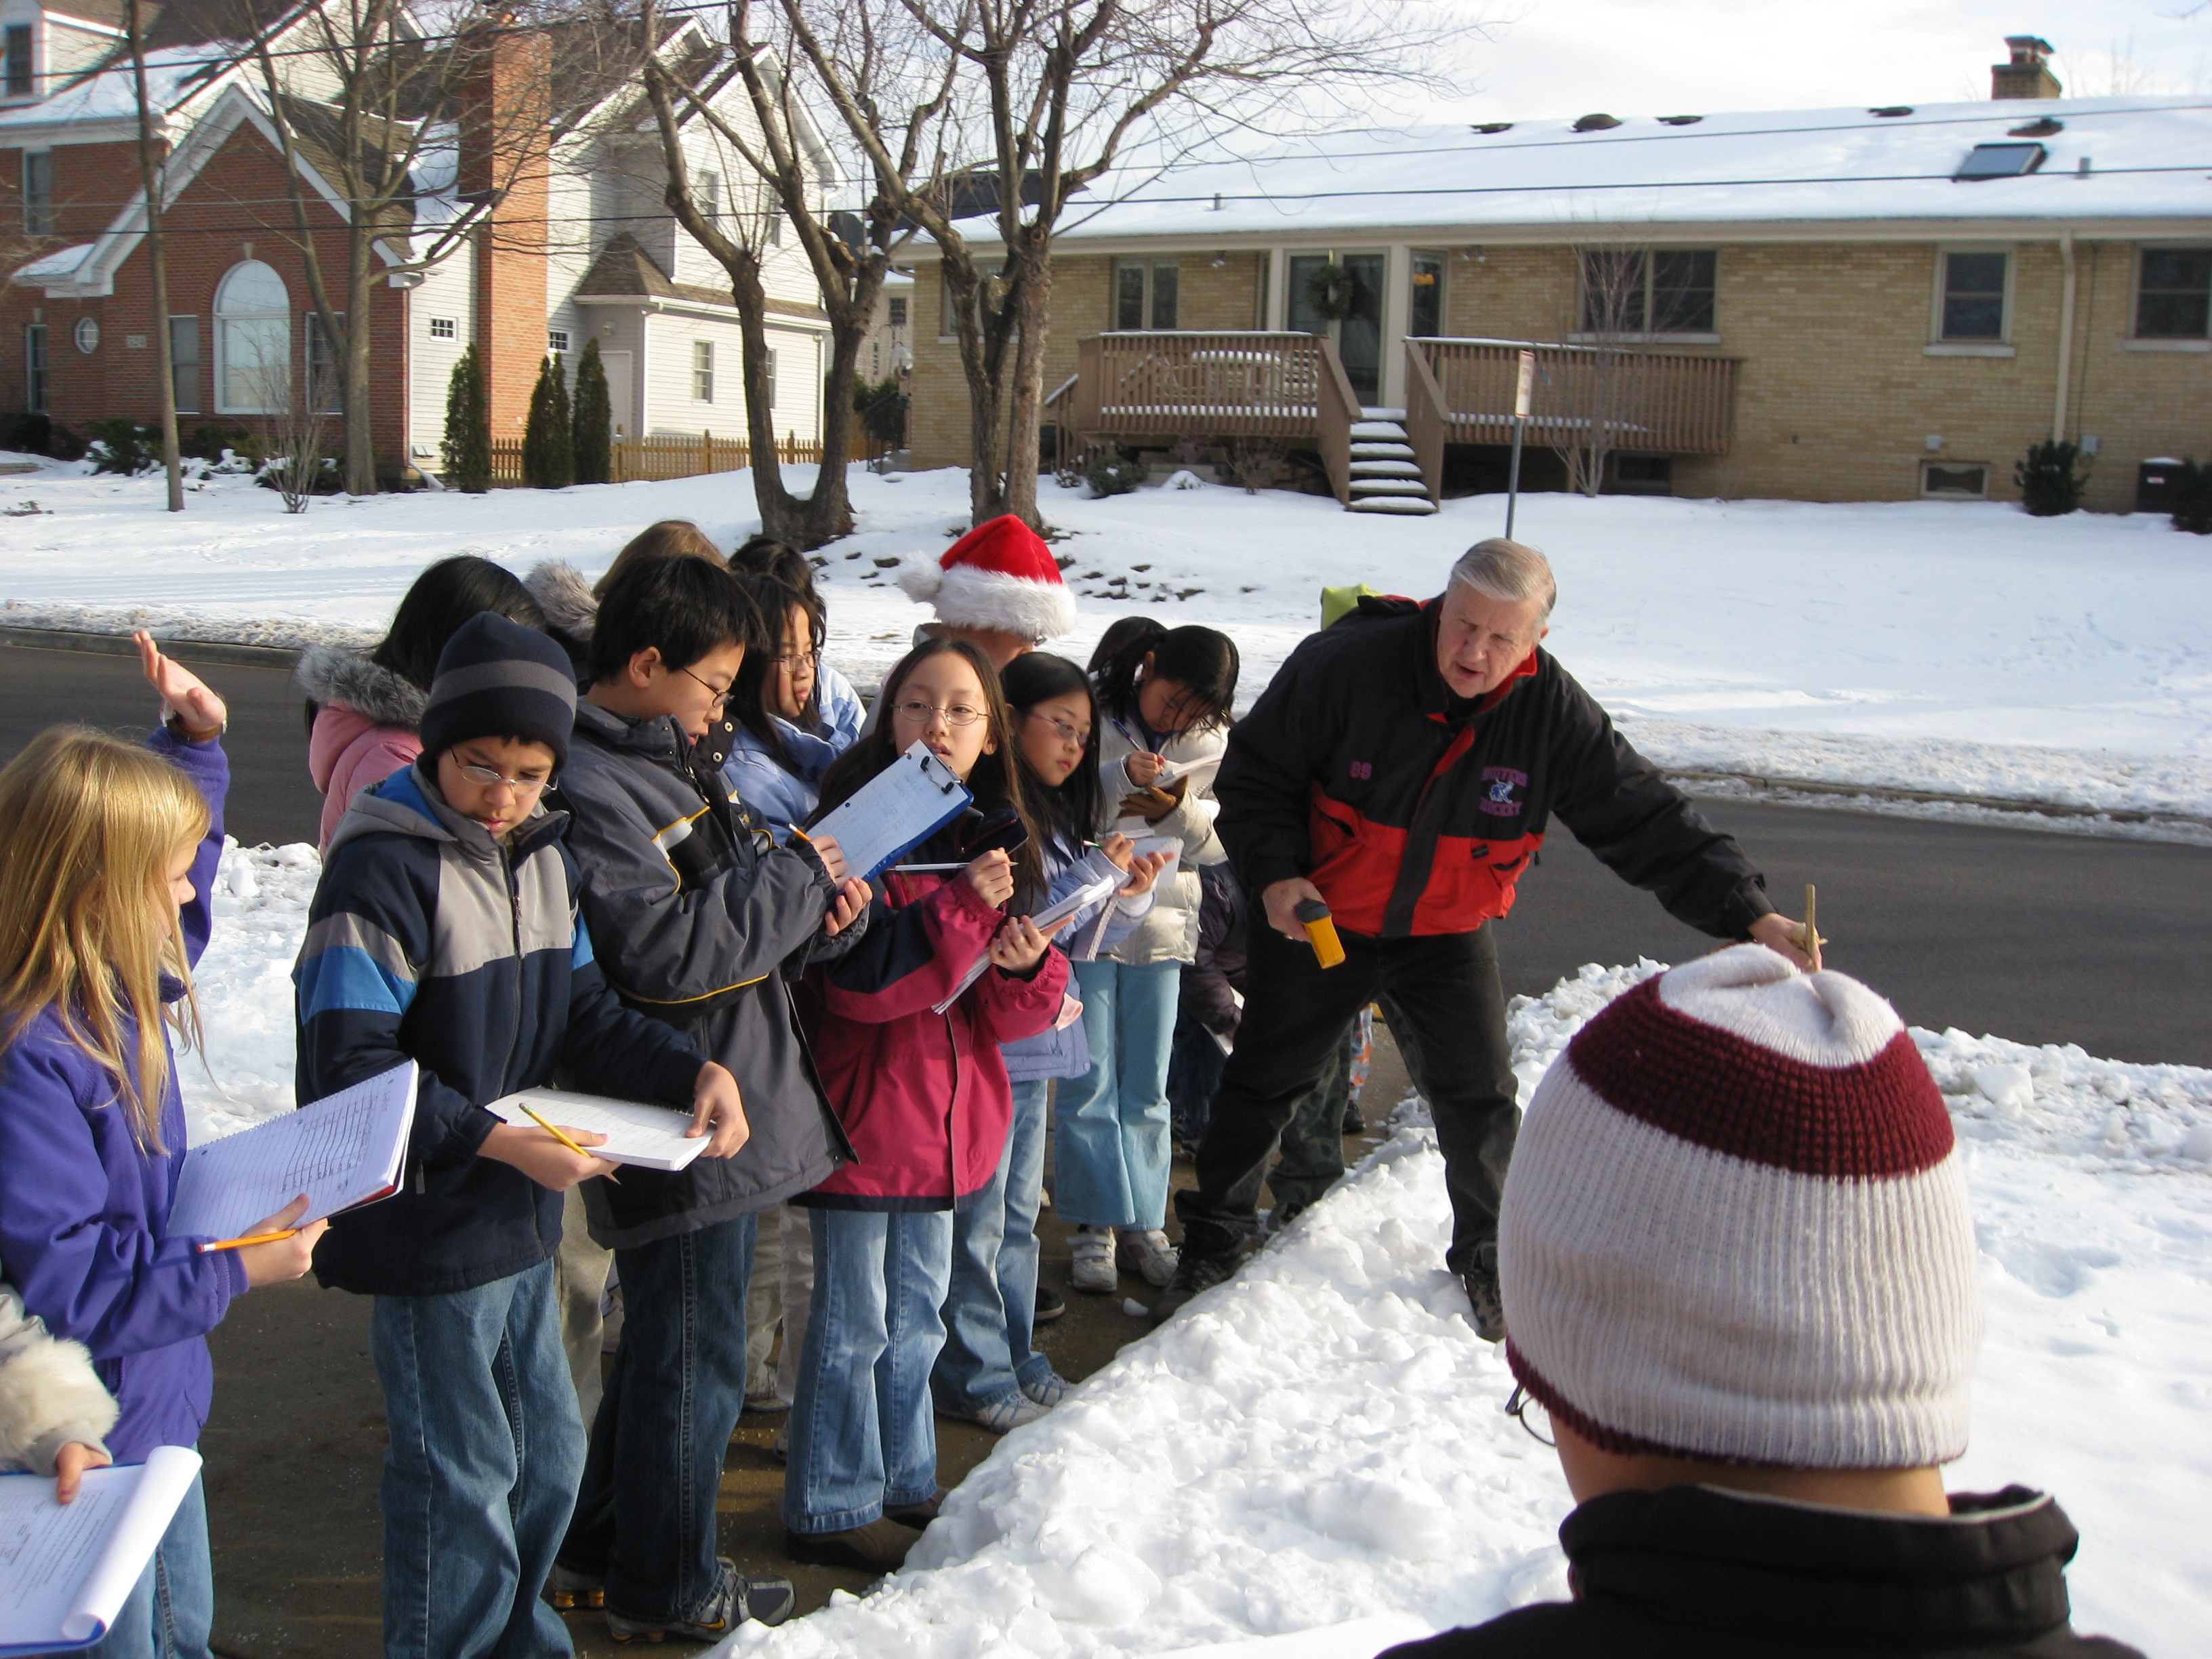
Students recorded the Universal Time of each reading. |
 |
 |
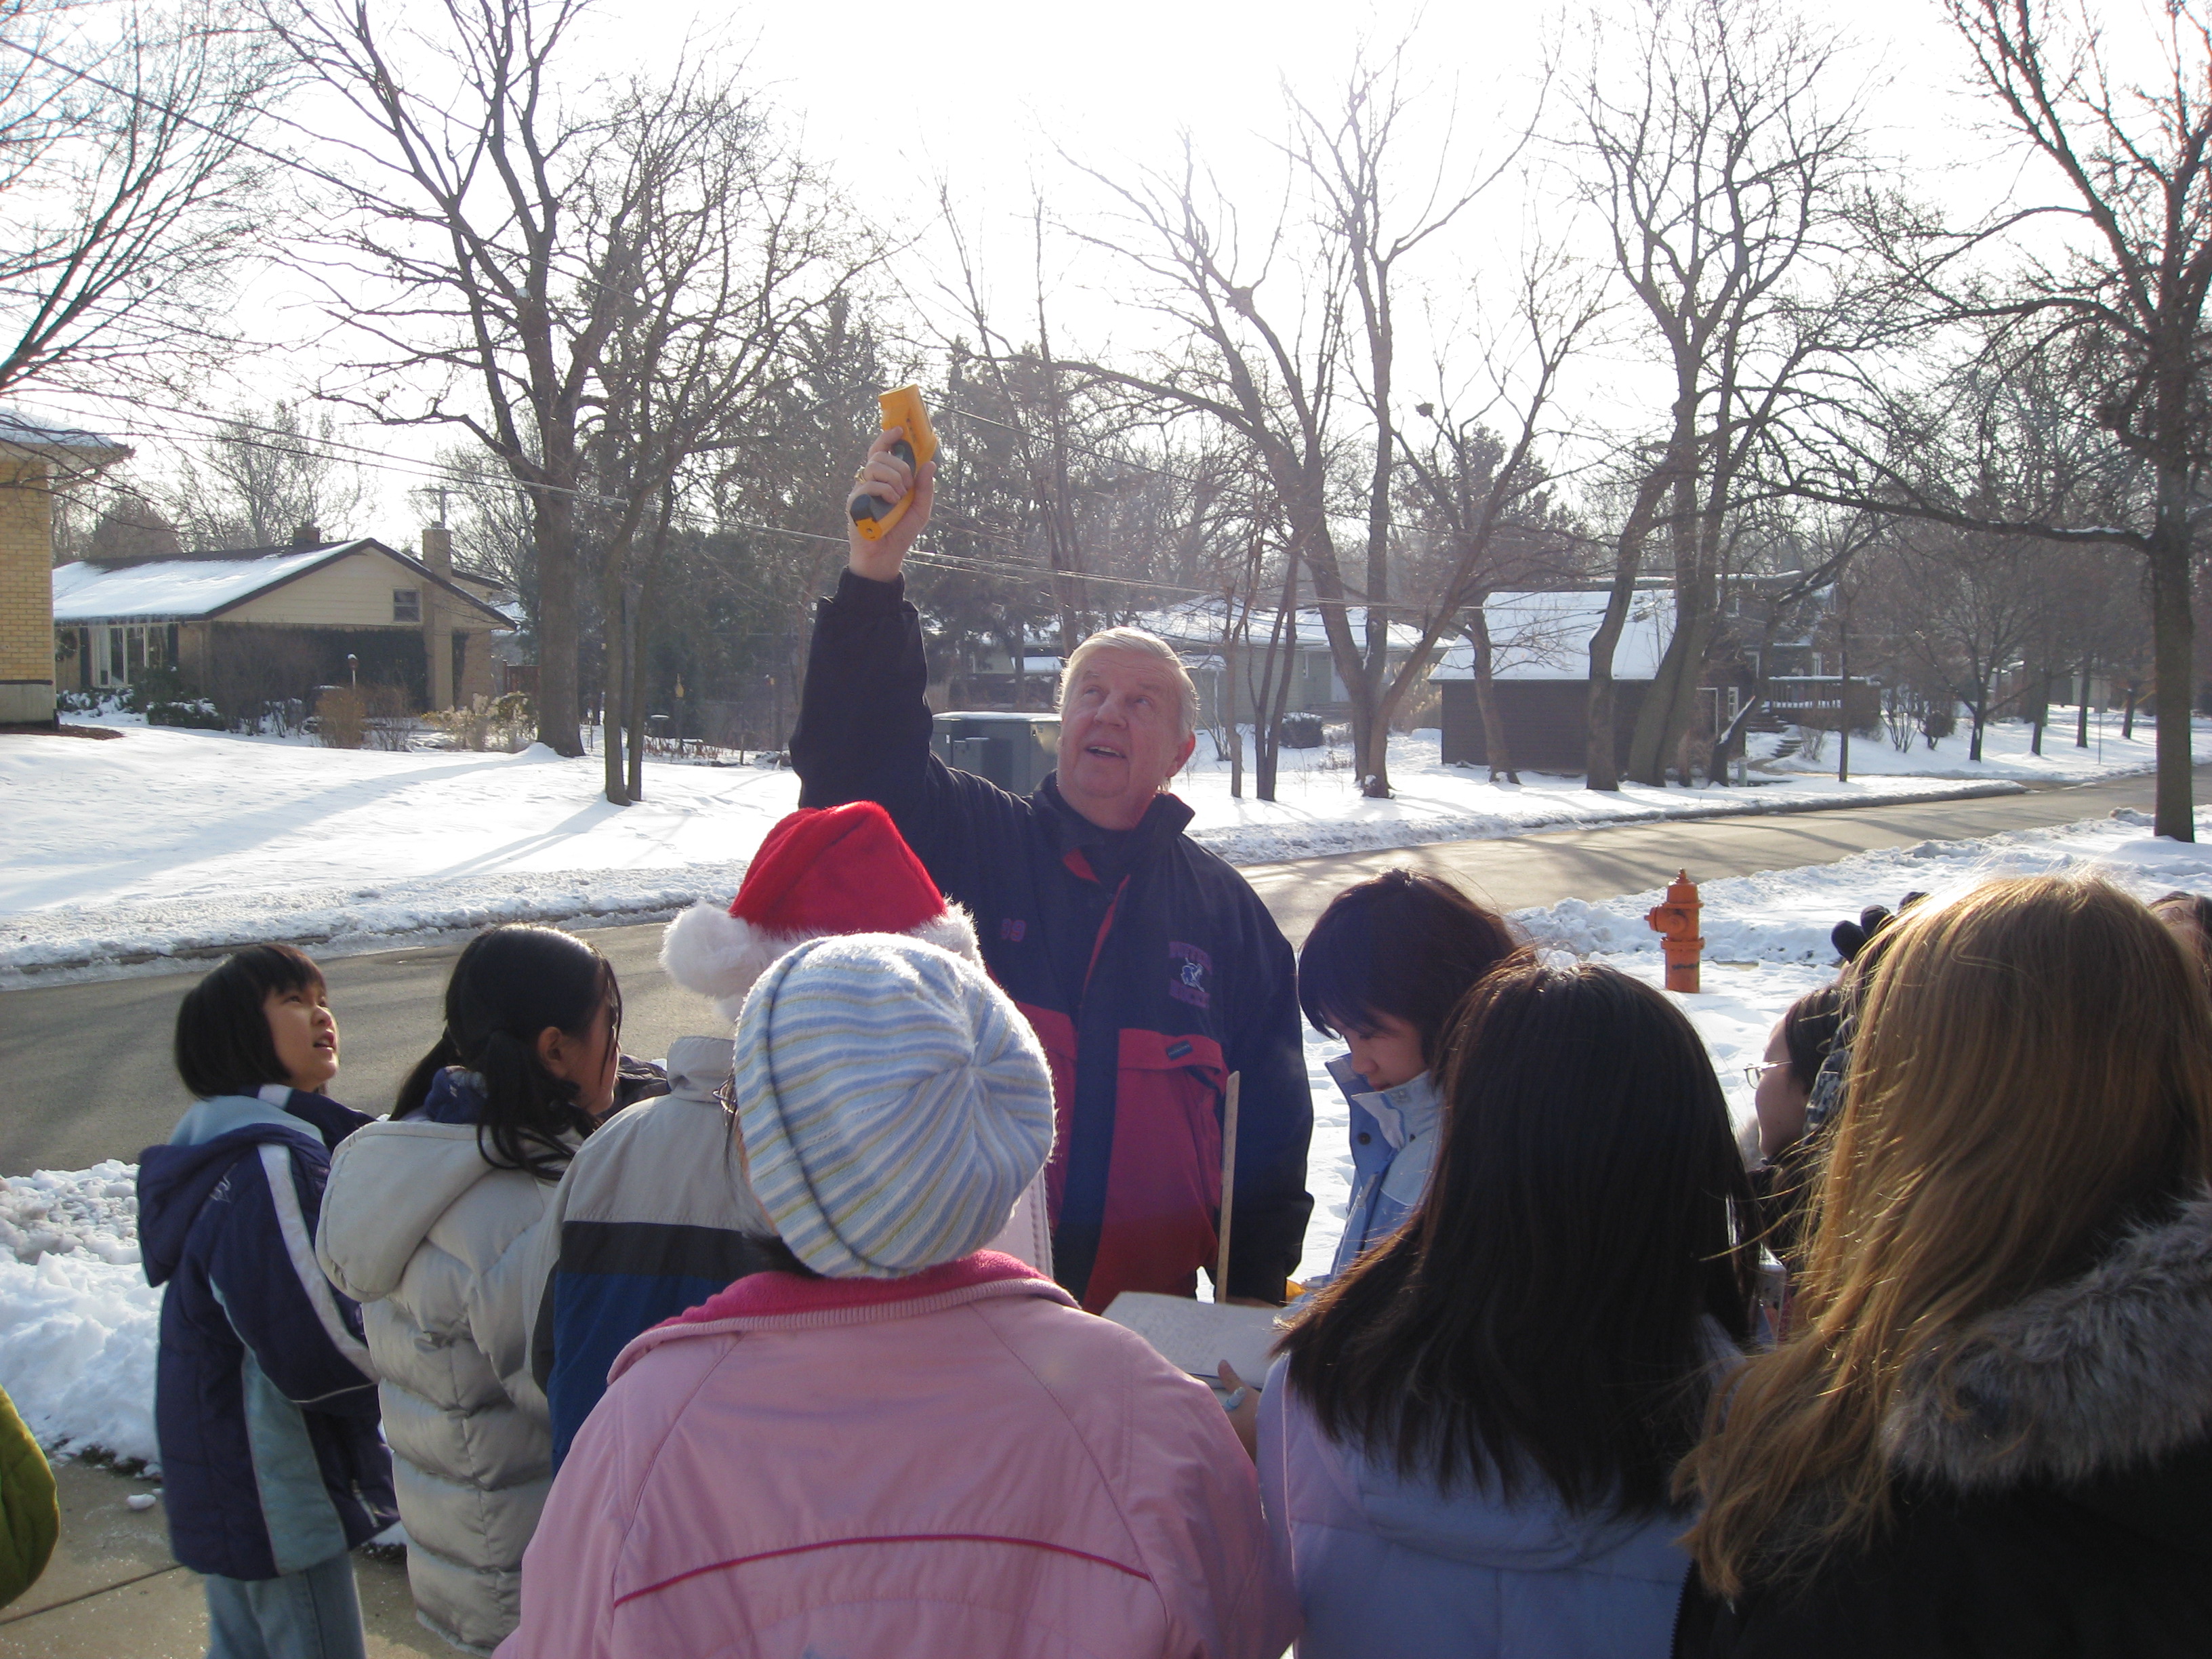
We also checked the cloud cover and cloud types. The Therm- ometer maxed out at -40 degrees when it was pointed at the sky. |
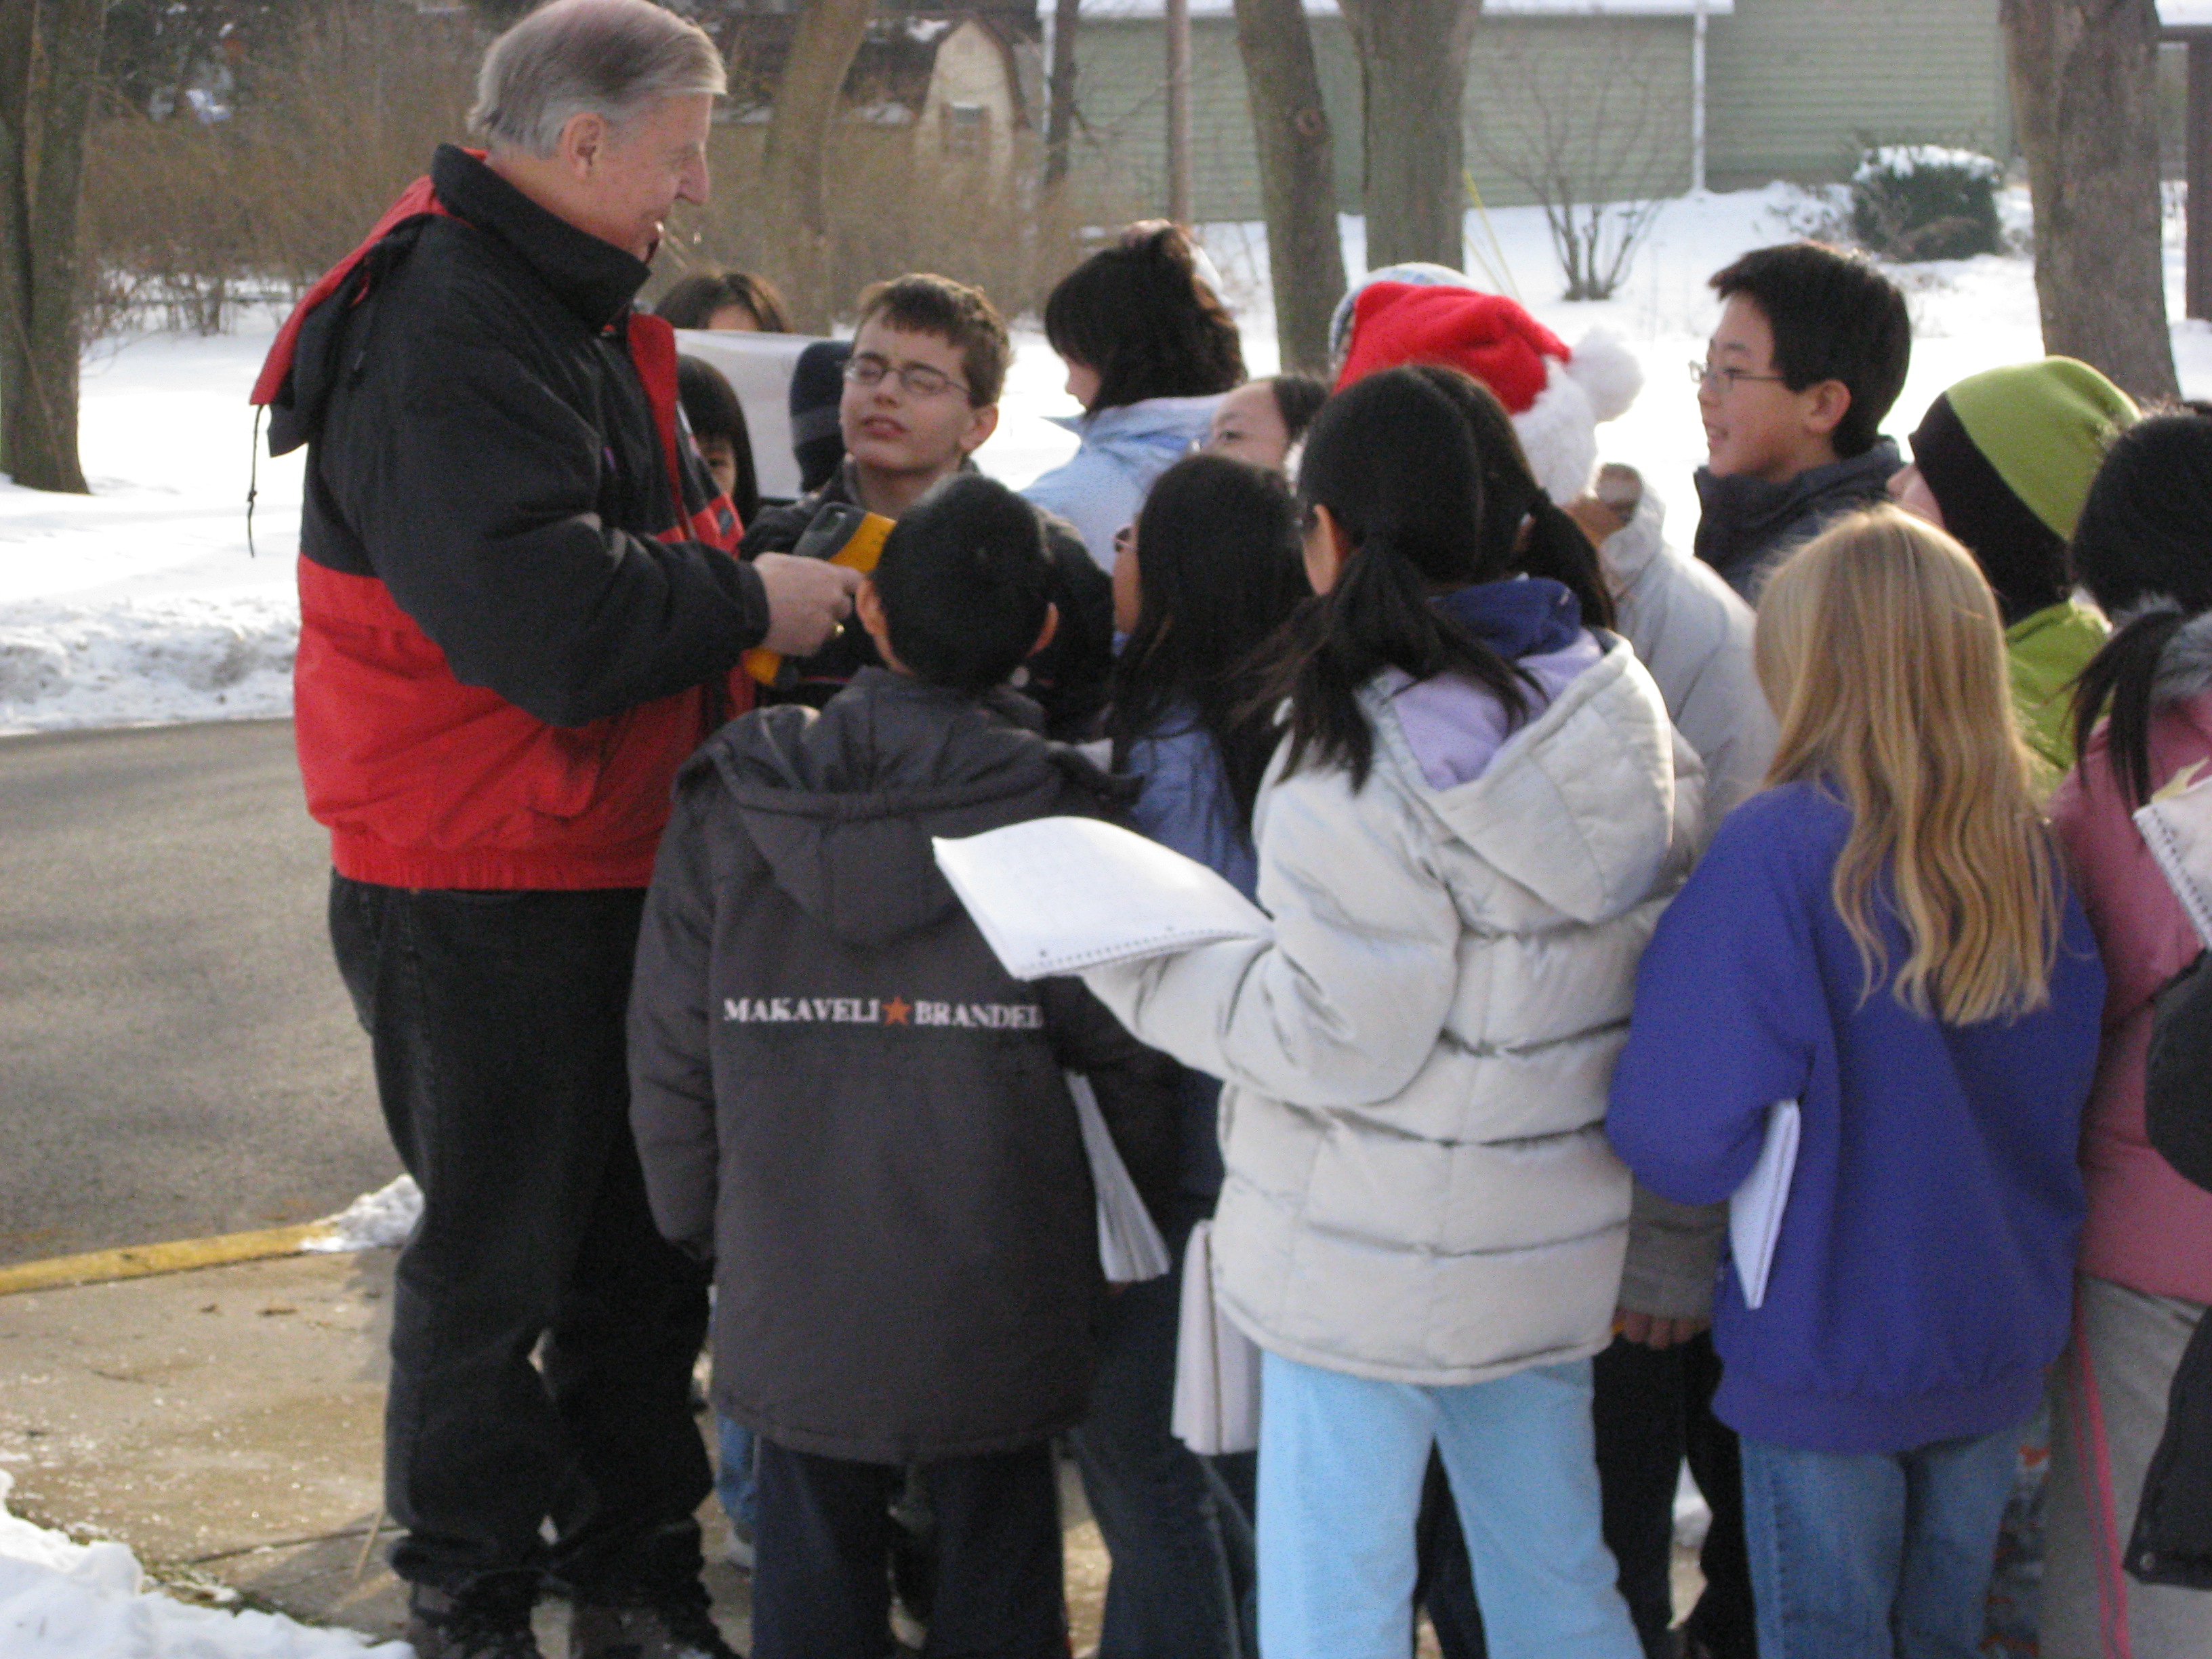
Students had fun getting outside for this activity. They had many more questions than answers. |
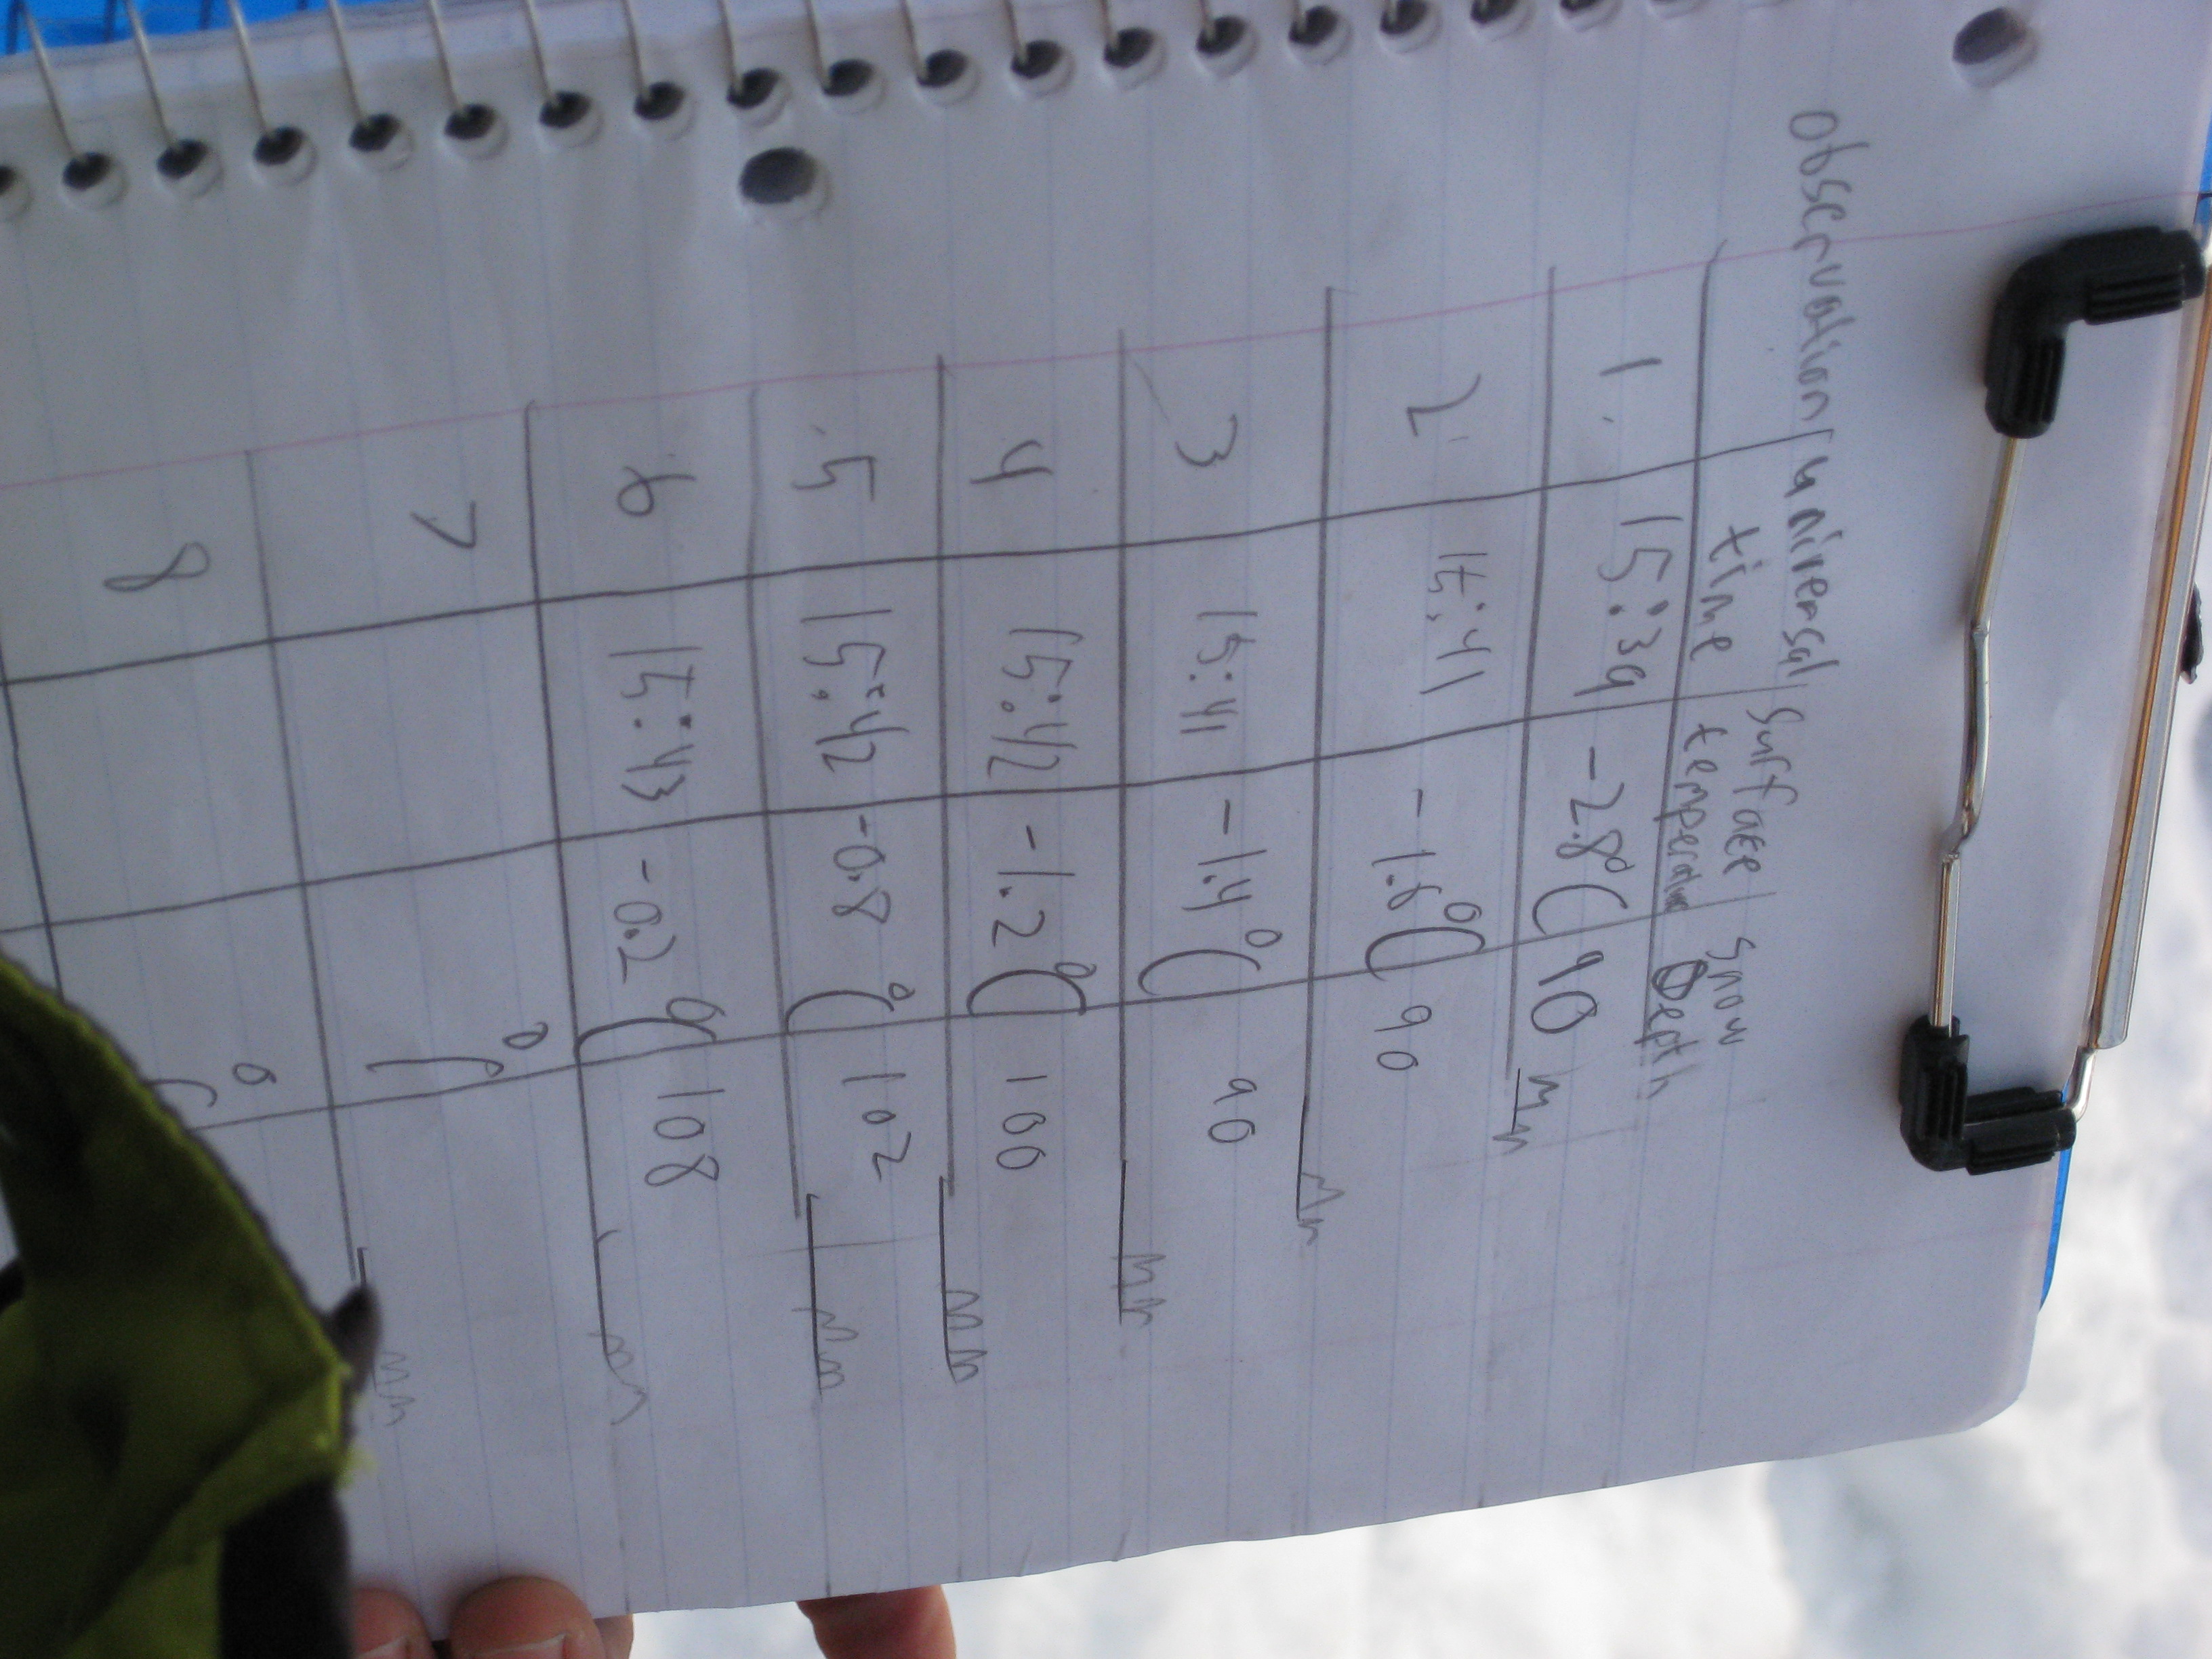
We took the student's data back into the school. The surface of the snow was between -2.8 and -0.2 Celsius. The sidewalk was + 4 C. |
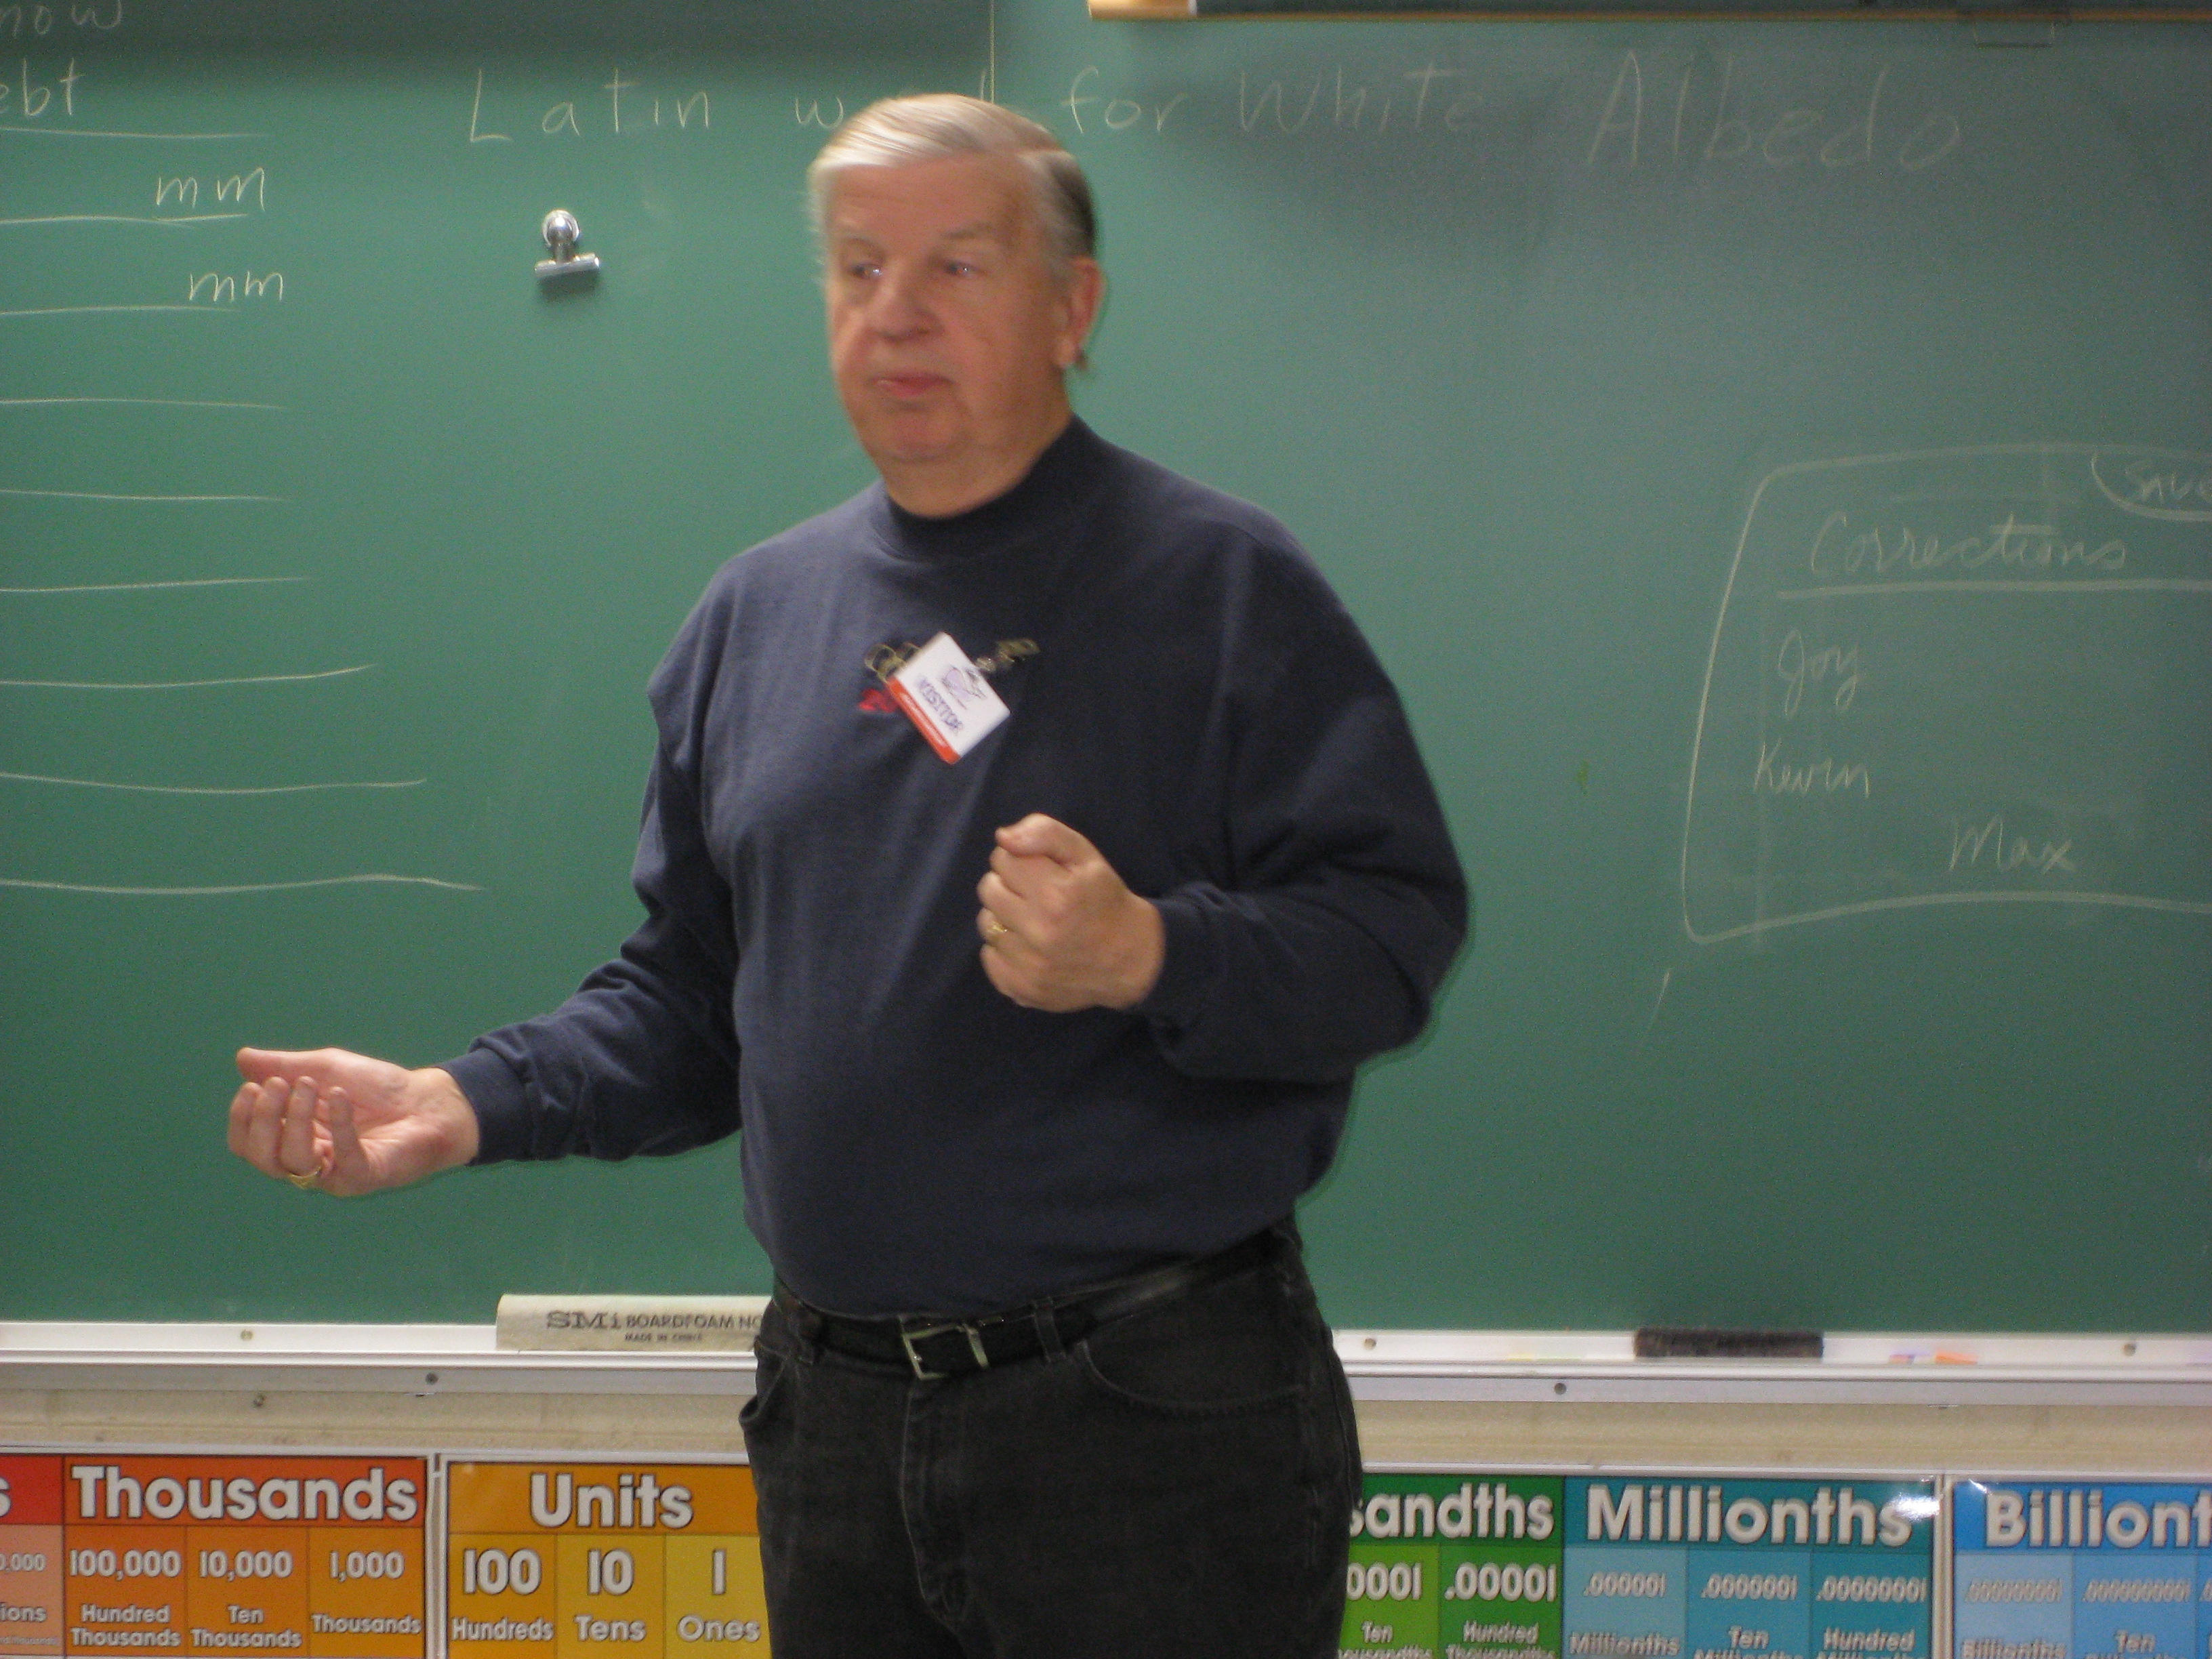
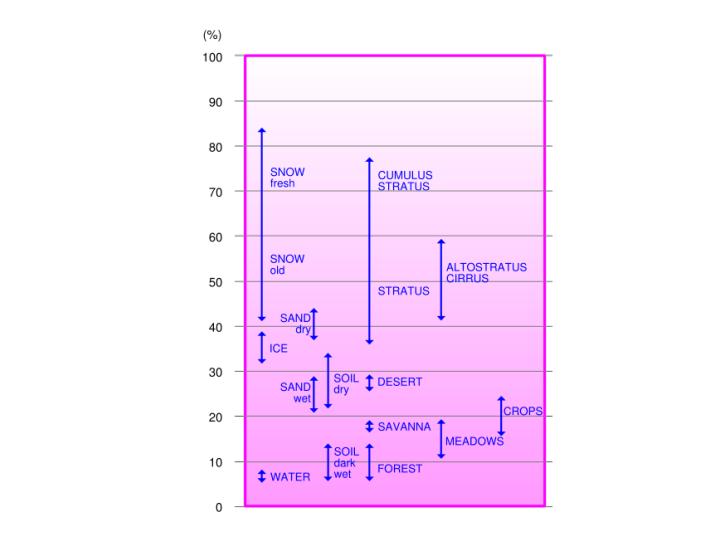
We discussed some of our data and looked for patterns. We talked about the difference of Albedo of the snow and the sidewalk. |
| Ms. Kouri logged on to the GLOBE Site, where she defined
our site, and entered the data into the GLOBE data base. Students
and Mr. Lopatka were able to watch the process on the screen, so that
students will be able to enter the data next time. Highlands School
joins 32 other schools from around the world in the
Surface Temperature Field Campaign led by Dr. Kevin
Czajkowski, Associate Professor
at The University of Toledo.
The following is a list of schools that are taking surface temperatures: Roswell Kent Middle School, Akron, Ohio, USA – 37 observations
Rockhill Elementary School, Alliance, Ohio, USA – 28 observations
Dalton High School, Dalton, Ohio, USA – 64 observations
Chartiers-Houston Jr./Sr. High School, Houston, Pennsylvania, USA
Cloverleaf High School, Lodi, Ohio, USA – 37 observations
The Morton Arboretum Youth Education Dept., Lisle, Illinois, USA
Mill Creek Middle School, Comstock Park, Michigan, USA
Kilingi-Nomme Gymnasium, Parnumaa, Estonia – 22 observations
Polaris Career Center, Middleburg Heights, Ohio, USA
National Presbyterian School, Washington, DC, USA
White Cloud Public, White Cloud, Michigan, USA – 33 observations
Blue Valley High School, Stilwell, Kansas, USA
Perkins Middle School, Akron, Ohio, USA
Steeple Run School, Naperville, Illinois, USA
Kittrell Elementary School, Waterloo, Iowa, USA
Lorain Community College Early College High School, Elyria, Ohio, USA – 46 observations
Ingomar Middle School, Pittsburgh, Pennsylvania, USA
Moosewood Farm Home School, Fairbanks, Alaska, USA – 21 observations
Roxboro Middle School, Cleveland Heights, Ohio, USA
Bowling Green State University, Bowling Green, Ohio, USA – 28 observations
Ida Elementary School, Ida, Michigan, USA
Whitehall High School, Whitehall, Michigan, USA - 22 observations
Taaksi Basic School, EE2914, Viljandimaa, Estonia
Birchwood School, Cleveland, Ohio, USA – 34 observations
Gimnazium in Toszek, Toszek, Poland – 20 observations
Waynesboro
Senior High School, Waynesboro, Pennsylvania, USA
Eastwood
Middle School, Pemberville, Ohio, USA Orange
Elementary School, Waterloo, Iowa, USA Estes
Park High School, Estes Park, Colorado, USA Hudsonville
High School, Hudsonville, Michigan, USA University
of Toledo, Toledo, Ohio, USA Main Street School, Norwalk, Ohio, USA - 20 observations
This chart shows the Albedo (Latin for White) of different materials and helps explain why the surface temperature of the snow was much colder than the sidewalk. Click here for more on Surface Temperature and freeze up studies.
|